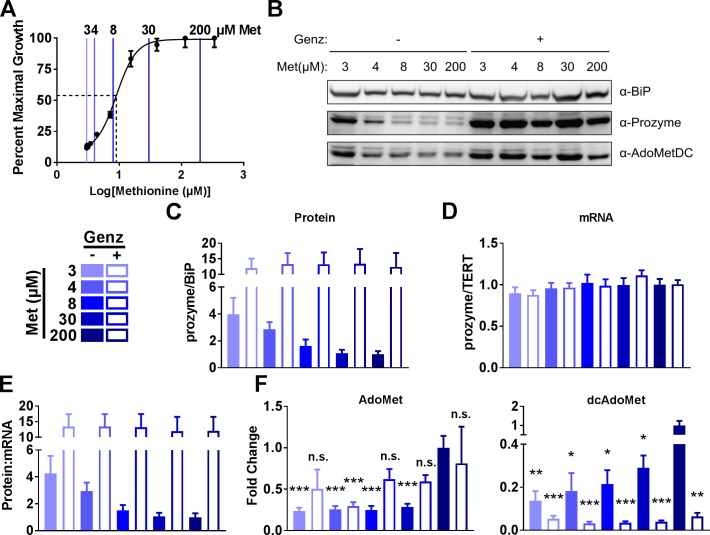
Fig 6. Methionine starvation upregulates prozyme.
(A) Cell viability of BSF 427 cells grown for 48 h in methionine-free HMI-19 media with 10% FBS supplemented with varying levels of methionine (Met) as indicated. Viable cells were quantitated by CellTiter Glo assay. Colored bars mark methionine levels used in Fig 6B, 6C, 6D, 6E and 6F. The dotted line marks the fitted EC50 (mean ± standard error of the fit = 9.0 ± 0.85 μM). Error bars represent SD for three biological replicates. (B) BSF 427 cells cultured for 48 h with varying levels of methionine and then treated ±Genz-644131 (15 nM) 24 h prior to harvest. (C) Quantitation of the western blot in Fig 6A normalized to Met 200 μM –Genz. (D) RT-qPCR analysis of prozyme mRNA from cultures used in A normalized to Met 200 μM –Genz. (E) Protein:mRNA ratio. (F) Fold change of dcAdoMet and AdoMet metabolite levels measured by LC-MS normalized to Met 200 μM –Genz. For Fig 6C, 6D, 6E and 6F, error bars represent SEM for three biological replicates, n = 3. For F, significance was determined by multiple T test analysis in GraphPad Prism comparing samples to Met 200 μM –Genz. * P<0.05, ** P<0.01, *** P<0.005.

