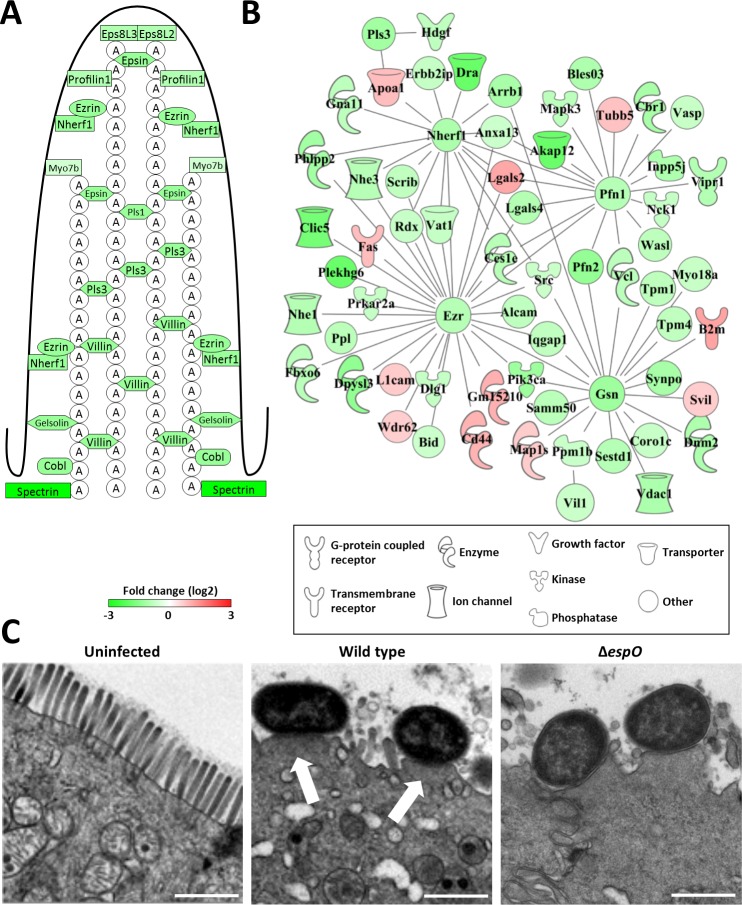
Fig 2. The A/E lesion signature of C. rodentium infection.
(A) Schematic representation of a microvillus with structural protein abundance 8 DPI. (B) Interaction network of brush border related proteins 8 DPI. (C) TEM micrographs of uninfected and infected IECs, showing A/E lesions on 8 DPI (arrows, scale bar 1 μm).

