
Figure 3.
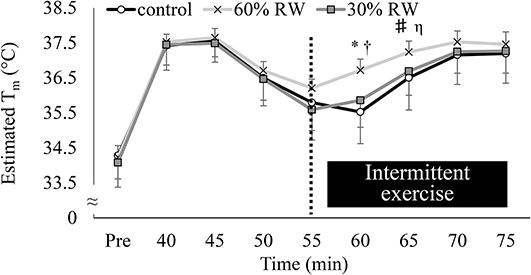
The estimated muscle temperature at each measurement point among 3 trials. Control: 15 minutes of seated rest trial, 60% RW: moderate-intensity (60% of V̇o2max) RW trial, 30% RW: low-intensity (30% of V̇o2max) RW trial, estimated Tm: the estimated muscle temperature. (n = 11, mean ± SD). A main effect of trial; p > 0.05, a main effect of time; p > 0.05, interaction; p < 0.05. *Significantly different from the control trial (p < 0.05). †Significantly different from the 30% RW trial (p < 0.05). #Tendency different from the control trial (0.05 < p < 0.1). ηTendency different from the 30% RW trial (0.05 < p < 0.1). RW = re–warm up.