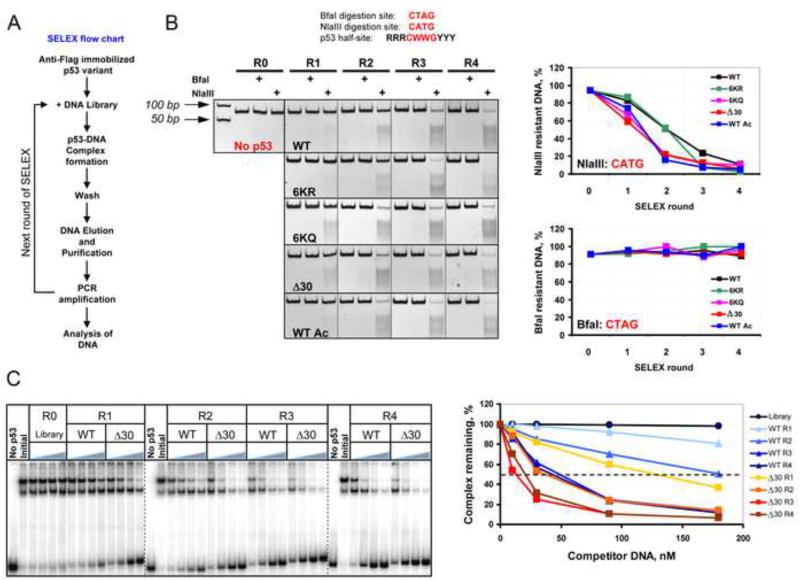
Figure 2. SELEX Reveals Substantial Differences in DNA Binding Site Selection Preferences of Wild Type and CTD-Modified Versions of p53.
(A). Flow chart depicting the SELEX protocol used to generate the pool of DNA targets selected by p53 CTD variants. (B). Upper: BfaI and NlaIII restriction endonuclease cleavage sites compared with the core element of the p53 consensus BS. Lower: DNA pools selected by p53 CTD modified or mutated proteins (See also Figure S2) in rounds 1–4 (R1, R2, R3, and R4) of SELEX were digested with NlaIII and BfaI and the reaction products were separated by 10% TBE PAGE. The gel boundaries are indicated with dotted lines. R0 - the initial degenerate pool of DNA targets. Graphs on right show the fraction of enzyme-resistant DNA specific to each p53 variant after each round of SELEX. The fraction of NlaIII- and BfaI-sensitive DNA in R0 was found to be ~1–2%. (C). Δ30 p53 was bound to 66 bp 32P-labeled mdm2 DNA in the presence of increasing concentration of unlabeled DNA that was pre-selected by either WT or Δ30 p53 in the different rounds of SELEX. The left panel shows a compilation of 3 representative PhosphorImager scans of 4 % native 0.5X TBE polyacrylamide gels. The gel boundaries are indicated with dashed lines. No p53 lanes: no Δ30 p53 in the reaction. Initial - no unlabeled DNA competitor in the reactions. The fraction of the remaining Δ30 p53-mdm2 DNA complexes in each condition expressed as a function of competitor DNA is shown on the right.

