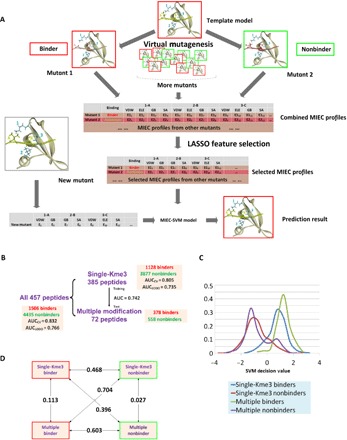
Fig. 3. Construction and validation of the chromodomain MIEC-SVM model.

(A) Flowchart of MIEC-SVM that predicts binding specificity between chromodomains and methyllysine peptides. Complex structures between 13 chromodomains and 457 peptides were constructed by computationally mutating peptide sequence from a template complex for each chromodomain (virtual mutagenesis). From the modeled complex structures, MIEC terms between peptide-protein residues at the binding interface were computed. The MIECs and the binding/nonbinding label (obtained from microarray experiments) for each domain-peptide pair were input to a LASSO logistic regression model to select most predictive MIECs (LASSO feature selection). These selected MIEC features were then used to train an SVM model to discriminate binding from nonbinding events. VDW, Van der Waals forces; ELE, electrostatic forces; GB, polar contribution to the desolvation energy; SA, nonpolar contribution to the desolvation energy. (B) Performance of MIEC-SVM model on three different peptide groups (all peptides, singly modified peptides, and multiply modified peptides). The MIEC-SVM model showed consistent performance regardless of the number of modifications on the peptides, indicating that chromodomain-peptide recognition share the same MIEC features for singly and multiply modified peptides. (C) SVM decision value distribution of the four classes of peptides (binders/nonbinders with single or multiple modifications). Binders and nonbinders are well separated regardless of the modification number. (D) Pairwise Jensen-Shannon (JS) divergences between the SVM decision value distributions of the four classes. The differences between any binder class and nonbinder class (regardless of the PTM number) are large (larger JS divergence value) singly modified binder–singly modified nonbinder, JS = 0.468 (P < 1.0 × 10⁻²⁰); singly modified binder–multiply modified nonbinder, JS = 0.396 (P < 1.0 × 10⁻¹⁹); multiply modified binder–single modified nonbinder, JS = 0.704 (P < 1.0 × 10⁻²⁰); and multiply modified binder–multiply modified nonbinder, JS = 0.603 (P < 1.0 × 10⁻²⁰). In contrast, binder (or nonbinder) peptides are similar to each other regardless of the PTM numbers: JS values of 0.113 for binders (P = 7.0 × 10⁻¹⁵ for statistical similarity) and 0.027 for nonbinders (P = 6.1 × 10⁻¹⁰). All P values were calculated on the basis of the background distributions of JS divergence of randomly selected decision values for the same number of binders or nonbinders as the foreground.
