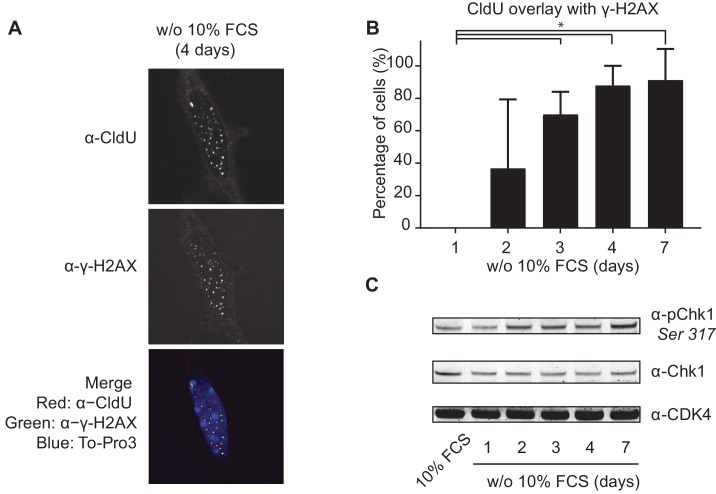
Figure 4. Mitogen-deprived TKO-Bcl2 MEFs suffer from replication stress.
(A) CldU and γ-H2AX foci in TKO-Bcl2 MEFs cultured in the absence of 10% FCS for 4 days. DNA was labeled with To-Pro3. In the merged picture, DNA is blue, γ-H2AX is green, CldU is red and co-localization of γ-H2AX and CldU is seen as yellow foci. (B) Quantification of CldU positive TKO-Bcl2 MEFs cultured in the absence of 10% FCS for the indicated days that contained five or more superimposed γ-H2AX and CldU foci. At least 100 cells were counted per condition. Standard deviation (error bars) between at least five different microscopic slides are shown. Significant differences between average values are indicated with an asterisk (Student’s t-test, p<0.01). (C) pChk1 (Chk1 phosphorylated on Ser317, upper panel) and Chk1 protein levels (middle panel) in TKO-Bcl2 MEFs cultured in the presence or absence of 10% FCS for the indicated days. Anti-CDK4 was used as loading control (lower panel).

