. 2018 Oct 16;7:e37868. doi: 10.7554/eLife.37868

Figure 5. Loss of p53 restores the level of origin firing.

(A) Schematic representation of replication tracks generated after pulse labeling with CldU (red) and IdU (green). Ongoing forks were used to determine fork speeds (kb/min); 1st label and 2nd label origins are origins of replication initiated during the labelling period with CldU and IdU, respectively (upper panel). Representative images of DNA fibers of TKO-Bcl2 MEFs with and without 10% FCS (lower panel). (B) Replication fork speeds in TKO-Bcl2 and TKO-Bcl2-p53KO MEFs cultured in the presence or absence of 10% FCS for 1–7 days. Box plots represent interquartile ranges, horizontal bars denote the median, whiskers indicate 5–95 percentile and points are outliers. At least 350 track lengths of ongoing forks were measured (from three independent experiments) with ImageJ. Significant differences between median values are indicated with an asterisk (nonparametric Kruskal-Wallis test, p<0.05). (C) Quantification of origin firing in TKO-Bcl2, TKO-Bcl2-p53KO and TKO-Bcl2-p21KO MEFs cultured in the presence or absence of 10% FCS for 1–5 days. 1st label and 2nd label origins are shown as percentage of all labeled tracks (from three independent experiments). Significant differences between average values are indicated with an asterisk (p<0.05, Student’s t-test).

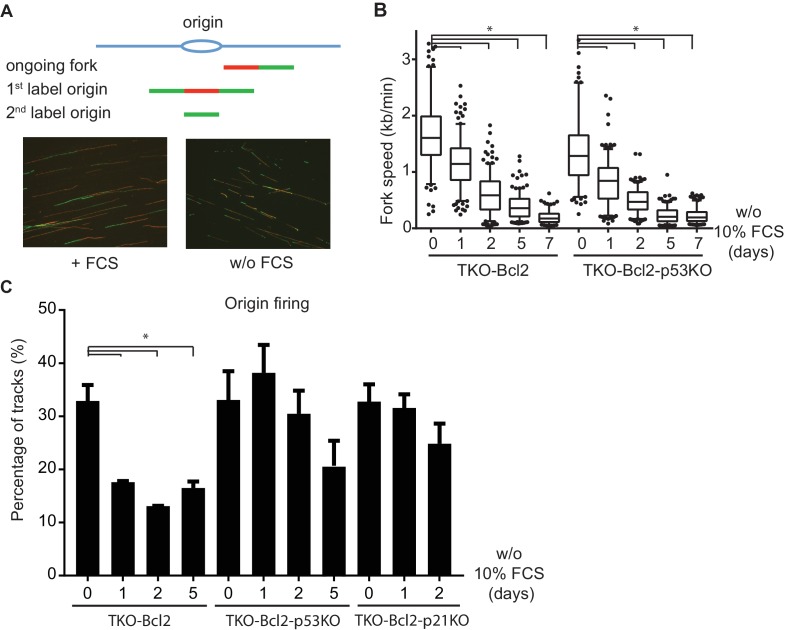
Figure 5.

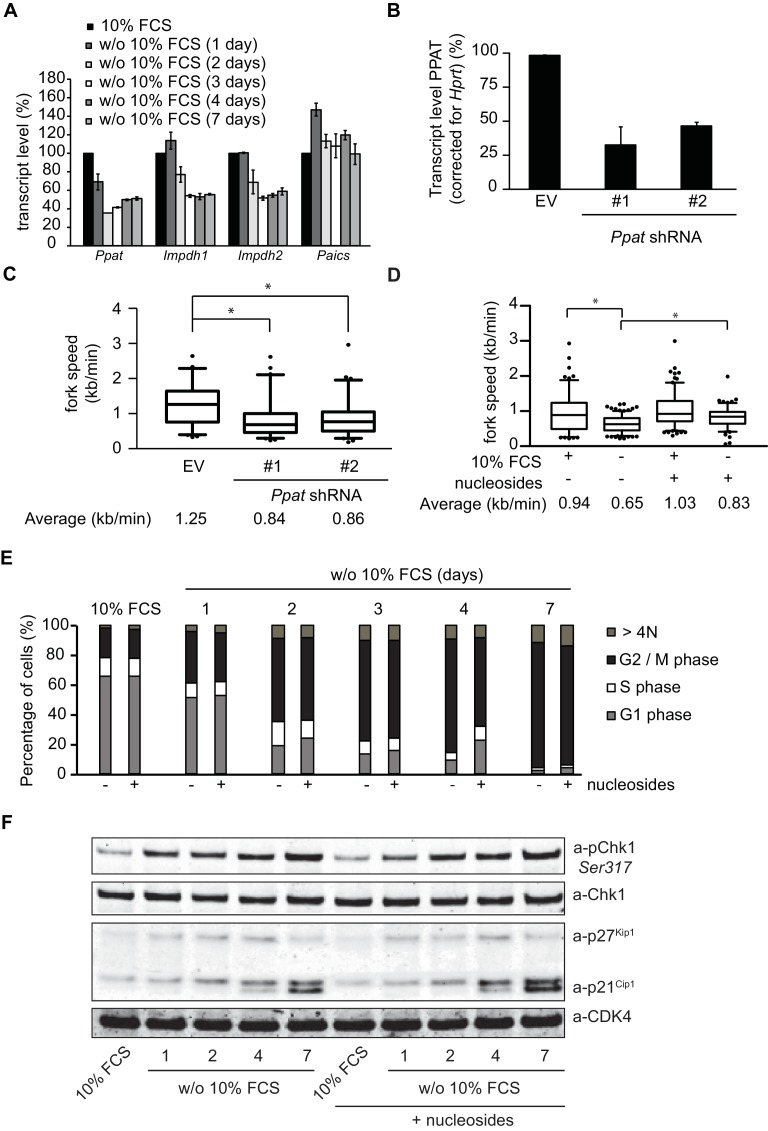
Figure 5—figure supplement 1. Nucleotide deficiency is not causal to G2 arrest.

Figure 5—figure supplement 1.

(A) Transcript levels of Ppat, Impdh1, Impdh2 and Paics (corrected for Hprt transcript levels) in TKO-Bcl2 MEFs cultured in the presence or absence of 10% FCS for the indicated days. The expression in the presence of 10% FCS is set as 100%. Standard deviation (bars) from two independent experiments is shown. (B) Transcript level of Ppat (corrected for Hprt transcript level) in TKO-Bcl2 MEFs 2 days after transduction with shRNAs against Ppat (#1 and #2) or non-targeting shRNA (EV, set as 100%). Standard deviation (bars) of three independent experiments is shown. (C) Replication fork speeds in TKO-Bcl2 MEFs 2 days after transduction with shRNAs against Ppat (#1 and #2) or non-targeting shRNA (EV). (D) Replication fork speeds in TKO-Bcl2 MEFs cultured in the presence or absence of 10% FCS for 1 day with or without the exogenous supply of nucleosides. For C and D, box plots represent interquartile ranges, horizontal bars denote the median, whiskers indicate 5–95 percentile and points are outliers. At least 100 track lengths of ongoing forks were measured. Average values marked with asterisk are significantly different (nonparametric Kruskal-Wallis test, p<0.05). (E) Cell cycle distribution of TKO-Bcl2 MEFs cultured in the presence or absence of 10% FCS for the indicated days with or without daily exogenous supply of nucleosides. (F) pChk1 (Ser317), Chk1, p21Cip1 and p27Kip1 protein levels in TKO-Bcl2 MEFs cultured in the presence or absence of 10% FCS for the indicated days in the presence or absence of nucleosides. Anti-CDK4 was used as loading control.
Figure 5—figure supplement 2. DNA replication stress induced by 0.3 and 2 mM Hydroxyurea.

Figure 5—figure supplement 2.

(A) Tail moments obtained from TKO-Bcl2 and TKO-Bcl2-p53KO cultured in the absence or presence of 0.3 or 2 mM HU for 1 hr. Box plots represent interquartile ranges, horizontal bars denote the median and points are outliers. For each condition, more than 50 cells were analyzed using the CASP software. Significance is indicated (nonparametric Mann Whitney test). (B) Quantification of origin firing of TKO-Bcl2 and TKO-Bcl2-p53KO MEFs after 1 hr treatment with 0.3 or 2 mM HU. Origins (green only) are shown as percentage of stalled (red only) and restarted tracks (red-green or green-red-green). The experiment was performed in duplicate. Error bars show standard deviation.