
Figure 5. Inhibition of NADPH-MDH and ribulose-5-phosphate kinase in leaves upon light-dark transitions, and non-soluble sugar contents in WT and 2cysprxAB during a 24 hr day-night cycle.
(A) MDH activity during a light-dark transition: WT and 2cysprxAB plants were exposed to 650 µmol quanta m−2 s−1 for 30 min and then darkened at t = 0 s. Proteins were rapidly extracted prior to darkening and after different time points in the dark as indicated. Initial (upper figure) and total MDH activity (lower figure) after full activation with 20 mM DTT were determined. Inactivation of MDH was slightly delayed in 2cysprxAB than in WT. This is shown for the time point 10 s. Data are means ± SD from n ≥ 5 determinations. (B) Ribulose-5-phosphate kinase (PRK) activity during a light-dark transition plotted as ratio of initial to total activity. WT and 2cysprxAB plants were illuminated with 650 µmol quanta m−2s−1 for 30 min and darkened as above. Initial and total PRK activities were determined and are represented as ratio. Initial inactivation was insignificantly delayed in 2cysprxAB, but while PRK in WT continued to be inactivated until 5 min, the PRK activity essentially remained unaltered and became significantly different at t = 300 s (n = 6). Complemented lines behaved like WT (supplements). (C) Changes in insoluble carbohydrates during a 24 hr day-night cycle. Leaves of WT and 2cysprxAB plants were harvested at 10 o’clock (1 hr after start of light phase), 15, 18, 20 (1 hr after end of light phase), 0 and 8 (1 hr before end of dark phase). Insoluble acid hydrolysable carbohydrates were quantified in the washed sediment of leaf homogenates using the Anthrone reagent following 1 hr boiling in sulfuric acid. Data are means ± SD of n = 3 extracts of different plants with three technical replicates each in Anthrone quantification. Statistics was calculated using one-sided ANOVA followed by Tukey’s HSD, while * = p ≤ 0.05.

Figure 5—figure supplement 1. Genotyping and protein detection in 2cysprxAB and two independent 2-CysPrxA-complemented lines (C1 and C2).

Figure 5—figure supplement 2. PRK activity in the complemented lines C1 and C2 in comparison to WT and 2cysprxAB.
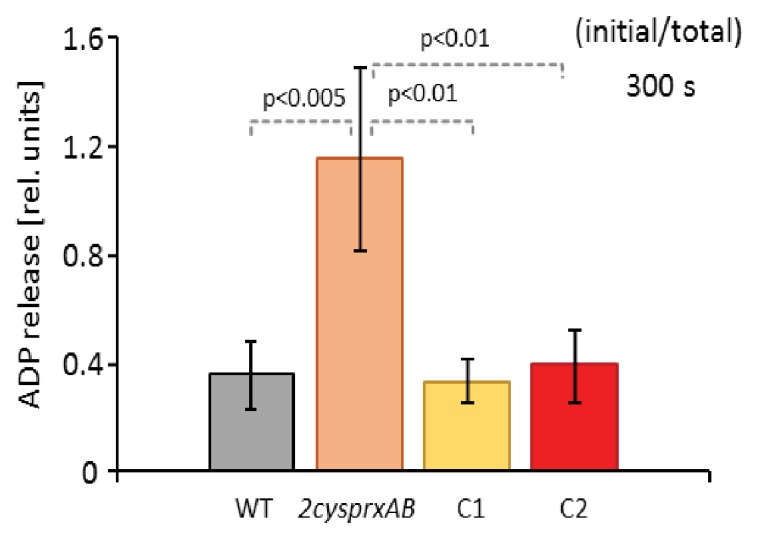
Figure 5—figure supplement 3. Simulation of redox change of FBPase upon darkening.
