. 2018 Oct 15;7:e35856. doi: 10.7554/eLife.35856

Figure 5. LRI frequency (A), wheezy LRI (wLRI) frequency (B), and HDM IgE (C), stratified by age-5 wheeze status, cluster and time, in the CAS dataset.

Points indicate means; bars indicate 95% CI (t-distribution). #p<0.05 for repeated-measures ANOVA across timepoints from the first 3 years of life (see Table 4). *p<0.05 for Mann-Whitney-Wilcoxon comparison within each timepoint.

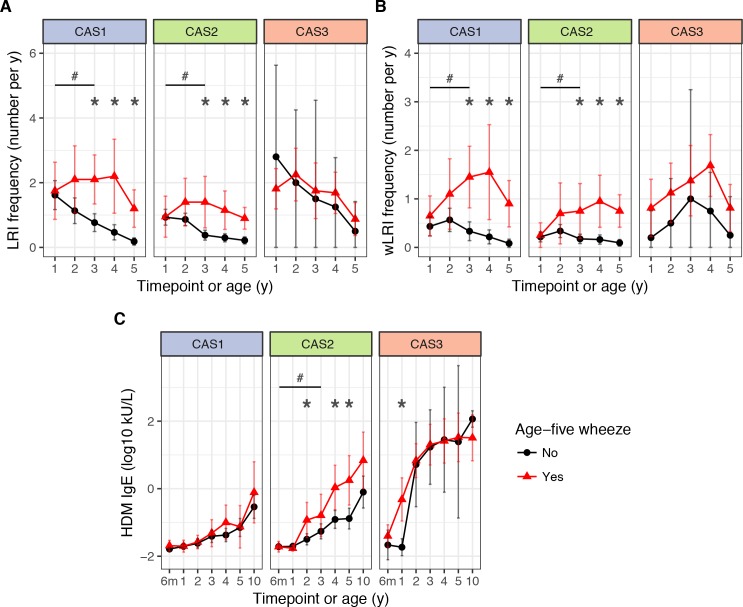
Figure 5.

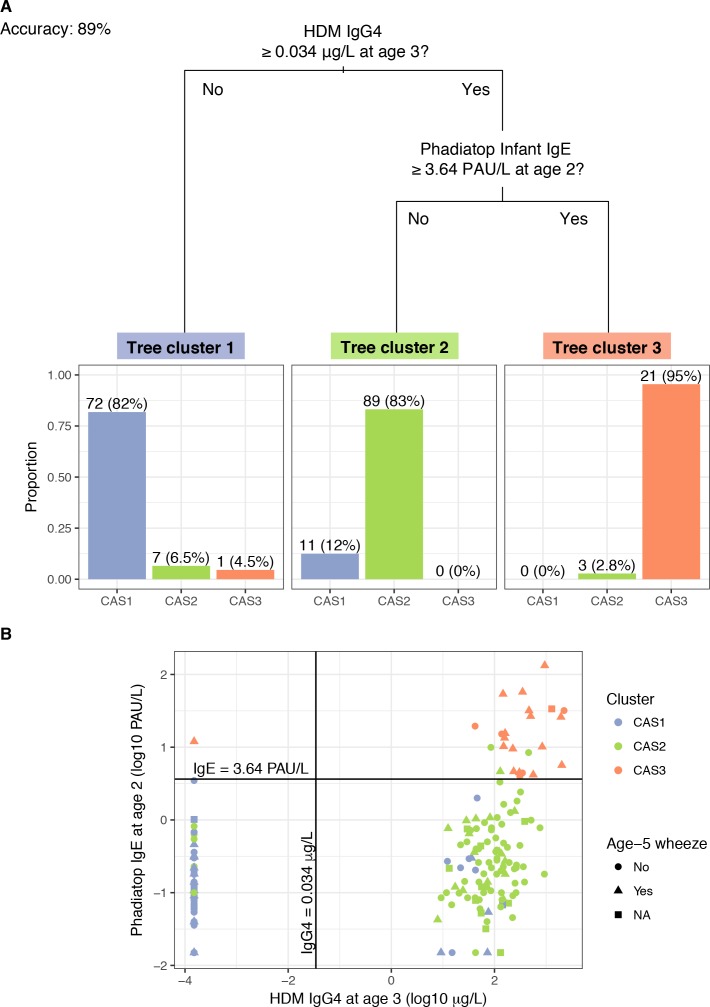
Figure 5—figure supplement 1. A ‘simple’ decision tree generated by recursive partitioning from CAS data, with breakdown of tree clusters by actual CAS npEM-derived clusters.

Figure 5—figure supplement 1.

(A); scatterplot showing separation of CAS clusters by decision split thresholds (B). Percentages in Panel A may not sum up to 100% because some individuals have missing values for decision node variables, hence making them impossible to classify. In Panel B, note that left-most column of points represent values of HDM IgG4 that were less than the limit-of-detection (LOD) for that assay (0.0003 μg/L) and were subsequently assigned to half the LOD (0.00015 μg/L). Most of these points belonged to individuals from CAS1.
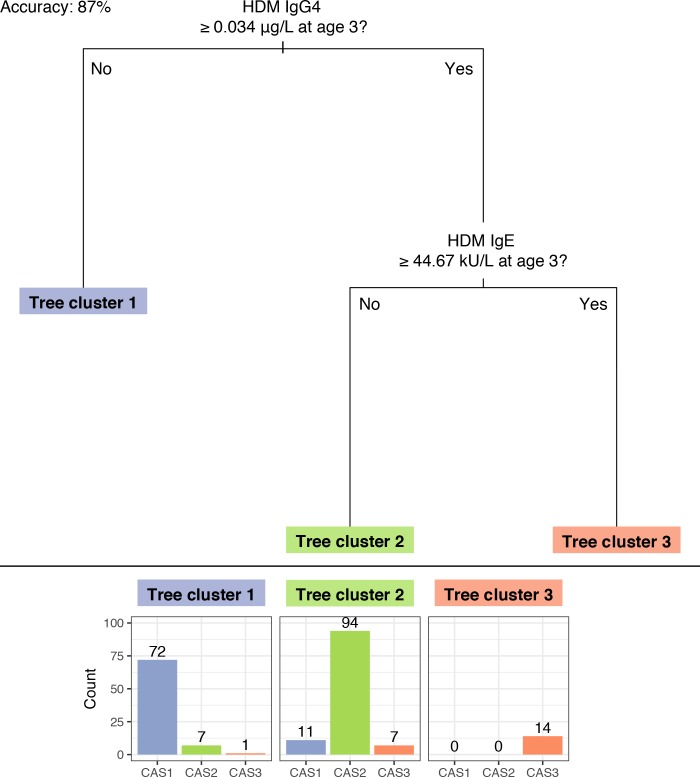
Figure 5—figure supplement 2. Decision tree generated by recursive partitioning from CAS data, excluding Phadiatop assay variables.

Figure 5—figure supplement 2.

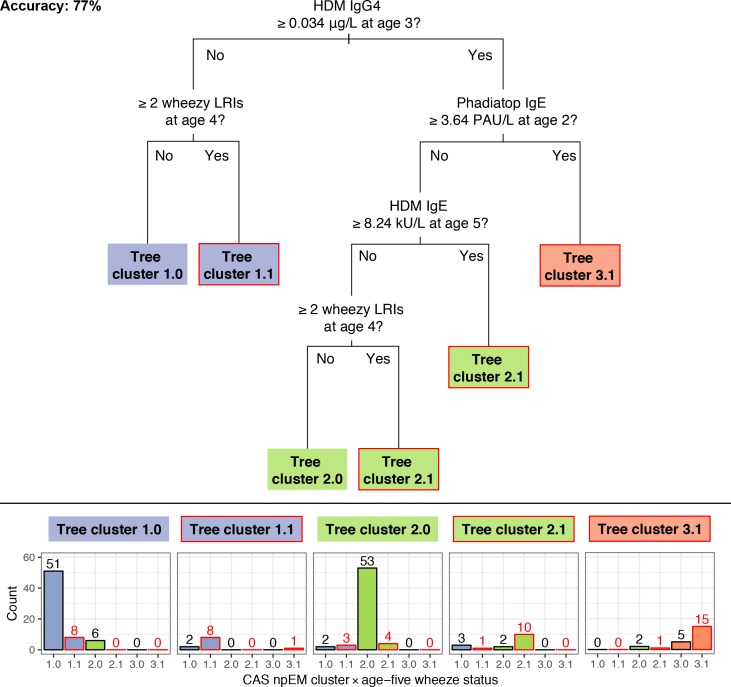
Figure 5—figure supplement 3. A ‘comprehensive’ decision tree generated by recursive partitioning from CAS data, given CAS npEM-derived clusters and age-5 wheezing status.

Figure 5—figure supplement 3.

CAS1.x, 2.x, and 3.x, and tree cluster 1.x, 2.x and 3.x, refer to the intersection of npEM-generated clusters and age-5 wheeze status, and their analogous decision tree cluster, respectively. The second digit (x.0 or x.1) refers to age-5 wheeze status, with ‘1’=present wheeze and ‘0’=no wheeze. Boxes, bars and digits with red outline indicate those with predicted (tree cluster) or actual (CAS npEM cluster) age-5 wheeze. Note that the tree did not predict for non-wheezing CAS3, so there is no tree cluster 3.0, and all CAS3 individuals were automatically assigned to a wheezing tree cluster.
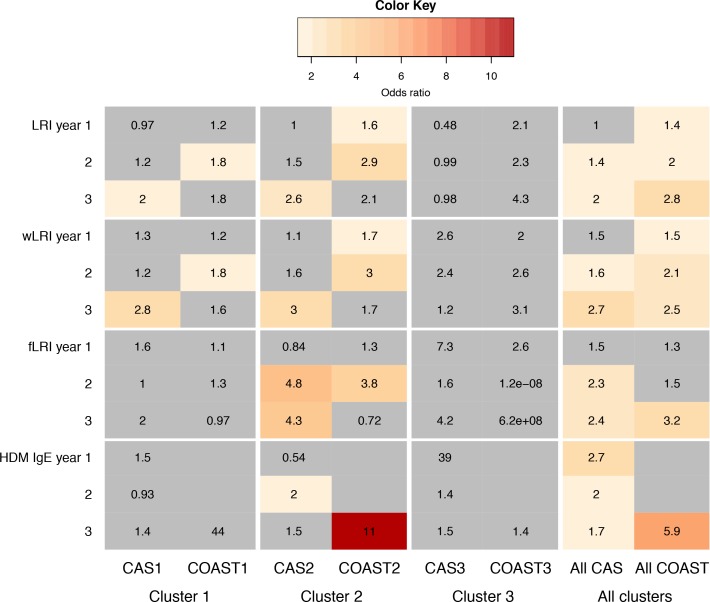
Figure 5—figure supplement 4. Comparison of predictors for age-5 wheeze in CAS and COAST clusters.

Figure 5—figure supplement 4.

Colour coding and numbers in cells indicate odds ratio (OR) of predictor for age-5 wheeze in GLM, with sex, maternal and paternal history of asthma, and (for CAS) BMI as covariates. Non-grey cell with number indicates statistically significant association (p<0.05). Grey cell with number indicates non-significant (p>0.05); grey non-numbered cell indicates test not done due to lack of data.