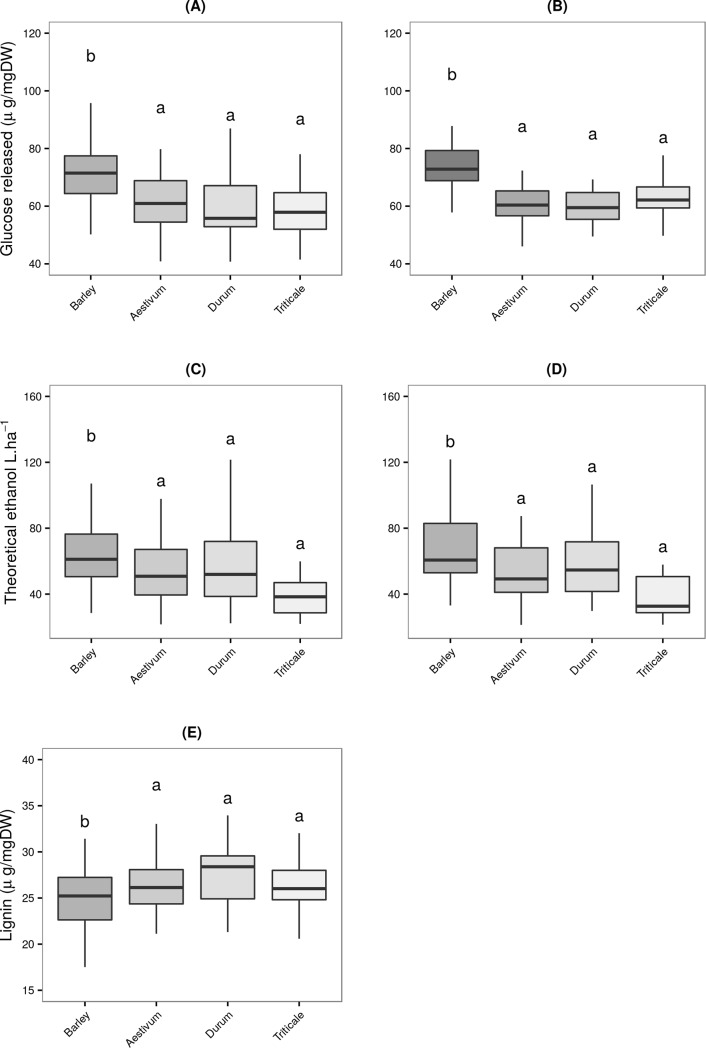
Fig 1. Comparative yield of glucose released in barley, wheat and triticale under different saccharification conditions.
Boxplot of glucose’s quantification released for wheat, barley and triticale under different saccharification conditions. (a) IAS; (b) CNAP. Mean (line), 25th-75th percentile (box) and 10th-90th percentile (whiskers) of glucose released for each genus. For each saccharification method, bars with different letters are significantly different (ANOVA, Tuckey HSD test, P≤0.05).

