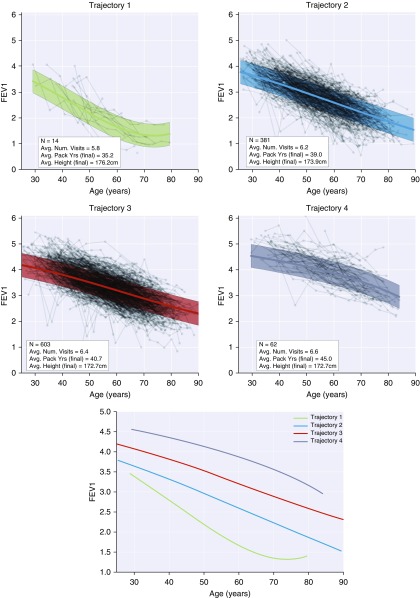
Figure 1.
Lung function trajectories identified by nonparametric Bayesian mixture modeling in the Normative Aging Study. Connected dots indicate sequences of subject visits. Thick lines indicate expected (population-averaged) FEV1 values as a function of age (assuming average height and pack-years of smoke exposure). Shaded regions represent FEV1 95% prediction interval estimated by the mixture modeling approach (see Discussion of Prediction Intervals in the online supplement for additional details).

