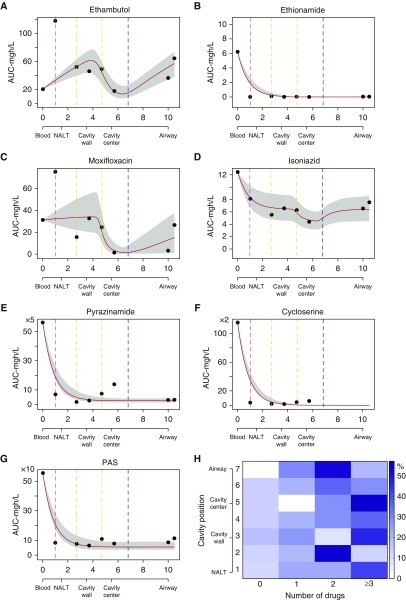
Figure 1.
Number of drugs and concentration gradient in a dynamical sink model. (A–G) Data points (circles) are mean area under the concentration–time curve (AUC) values at that cavity position, and the shaded area indicates 95% confidence intervals fitting to a dynamical sink model. The x-axis is distance in centimeters; we also include a description of cavity position on each x-axis. The colored vertical lines mark transition zones/boundaries between adjacent histopathological regions on the second x-axis. The y-axis is the 0- to 24-hour AUC in mg · h/L. For (A) ethambutol, (C) moxifloxacin, and (D) isoniazid, the potential “well” of the sink is at the air–caseum interface (marked “cavity center” in figure), and the shape suggests two directions of diffusion from outside the cavity and also directly into airways. For (B) ethionamide, (E) pyrazinamide, (F) cycloserine, and (G) para-aminosalicylic acid (PAS), there is steep decline, consistent with concentration declining inversely proportional to an exponent of the distance from the source. (H) Heat map showing the effective number of drugs at each location. The percentage of patients with the number of drugs at each position is shown by shades of blue (scale); as an example, in position 7 (airway) 50% of patients had two effective drugs (deep blue). The heat map shows the heterogeneity in drug penetration into each geospatial location. The number of effective drugs by cavity position using each of the three definitions is shown in Figure E4. NALT = normal-appearing lung tissue.

