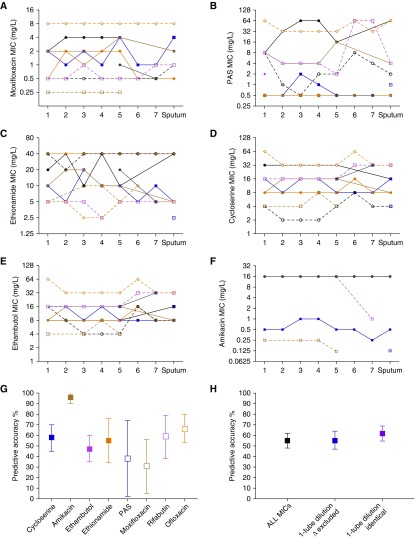
Figure 2.
Minimum inhibitory concentration (MIC) in sputum and by cavity position. (A–F) MICs of isolates from each patient are joined by a line to allow easy tracing across the tuberculosis cavity. Some of the lines for different patients overlapped. There were differences in MIC by greater than one-tube dilution in many instances. If standard critical concentrations are used to categorize “resistant” from “susceptible,” it can be seen for that for (A) moxifloxacin (0.5 or 2.0 mg/L), (B) para-aminosalicylic acid (PAS) (2.0 mg/L), (C) ethionamide (5.0 mg/L), (D) cycloserine (10/40 mg/L), (E) ethambutol (5.0/10 mg/L), and (F) amikacin (4.0 mg/L), there was a considerable proportion of patients with both drug-susceptible and drug-resistant isolates at the same time. (G and H) The square indicates the mean estimates, and bars indicate 95% confidence intervals. For each drug, we examined how accurate the sputum MIC value was in predicting the MIC of Mycobacterium tuberculosis isolates inside that patient’s single cavity. We tested isolates in one cavity from each patient, although most patients had more than one cavity.

