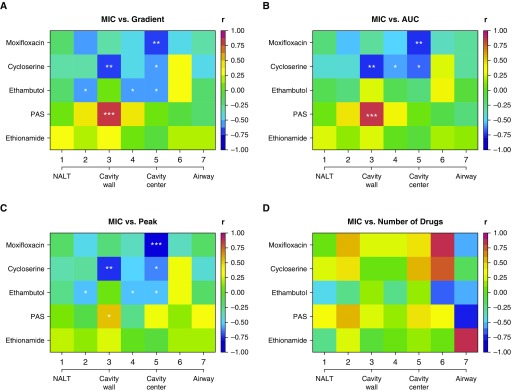
Figure 3.
Correlation of minimum inhibitory concentration (MIC) with drug parameters by cavity geospatial position. The cavity center denotes the air–caseum interface. We examined for both Pearson and Spearman correlations, as well as the Kendall tau. Results are for Spearman r. P values are encoded as not significant if ≥0.05. *P < 0.05, **P < 0.01, and ***P < 0.001. (A) The relationship of MIC to gradient, in this case expressed as the ratio of area under the concentration–time curve (AUC) at the cavity position to the AUC in the blood, shows a moderate to high negative correlation with MIC (i.e., darker blue) for all drugs except ethionamide and in several positions for para-aminosalicylic acid (PAS). For PAS, the significant P values are for a positive correlation between MIC and concentration. (B) The relationship between actual 0- to 24-hour AUC (mg · h/L) and MIC shows strong negative r for the drugs, except for PAS. (C) Similar findings are noted when peak concentration was used as drug concentration. These negative correlations shown in A–C indicate that high MIC (drug resistance) was associated with low drug levels (gradient, peak, and/or AUC). (D) Shows complex correlation patterns for number of drugs versus MIC. In general, the correlation between number of drugs and MIC was low, and no position had correlation associated with a P < 0.05. This means, surprisingly, that spatial monotherapy, or even dual therapy, was the least strongly correlated with acquired drug resistance, likely because eight or more drugs were administered. NALT = normal-appearing lung tissue.

