Figure 5.
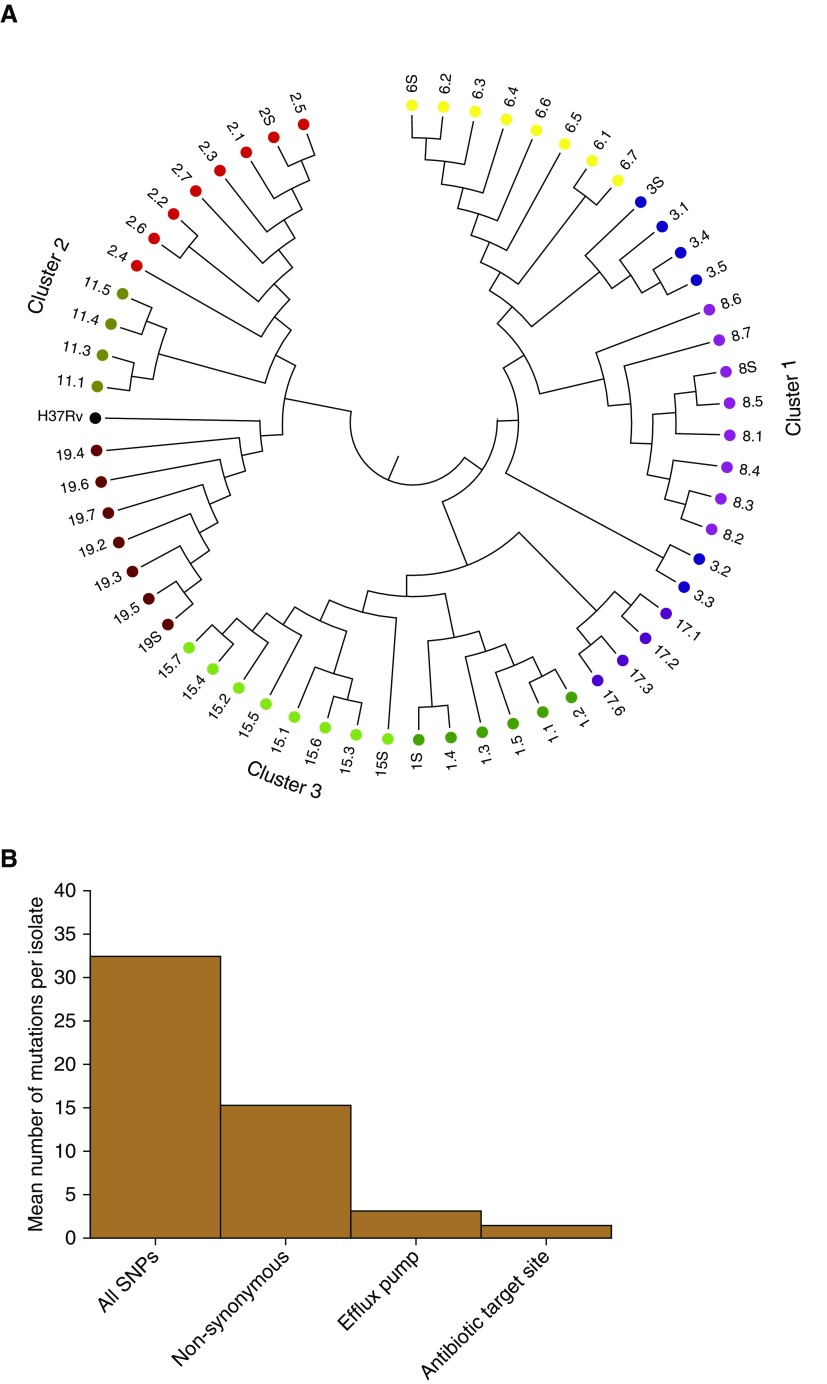
Whole-genome sequencing (WGS)-based variants in sputum and cavitary bacterial isolates. (A) WGS-based diversity of isolates revealed heterogeneity within each cavity, from patients who had more than two cavitary isolates that passed WGS quality control. Each color code indicates patient designation (also numbered), and the number (0.1, 0.2, 0.3, 0.4, 0.5, 0.6, 0.7, or S [sputum]) after the decimal indicates cavity positions specified in Figure E1. There were three clusters by relatedness and genetic distance; we give the position of the reference Mycobacterium tuberculosis H37Rv strain for context. As an example, sputum isolate 19.S differed from the neighbor 19.5 by 6 SNPs, shown by the bar height in the dendogram, whereas on the other extreme, 19.4 differed from 19.6 by 25 SNPs in the largest height for isolates in patient 19, within the same cavity. This shows much diversity of SNPs in each cavity; for the cavity in patient 3 (blue), there were two completely unrelated strains of different phylogenetic lineage. (B) y-axis shows the mean number of new mutations in the t = 1 isolate versus t = 0 isolate. Isolates from patients who had WGS of isolates before the current treatment episode (t = 0; time of diagnosis) revealed new nonsynonymous mutations compared with the time of lung explant or current treatment at t = 1. The mean number of SNPs in drug-resistance–associated genes (target site and efflux pumps) in the seven sets of isolates is for nonsynonymous mutations. Genes with new target site mutations included gyrA (quinolone resistance) and gidB (aminoglycoside resistance), consistent with evolution from multidrug-resistant tuberculosis before current treatment episode to extensively drug-resistant tuberculosis after ∼5 months of therapy.

