Fig. 3.

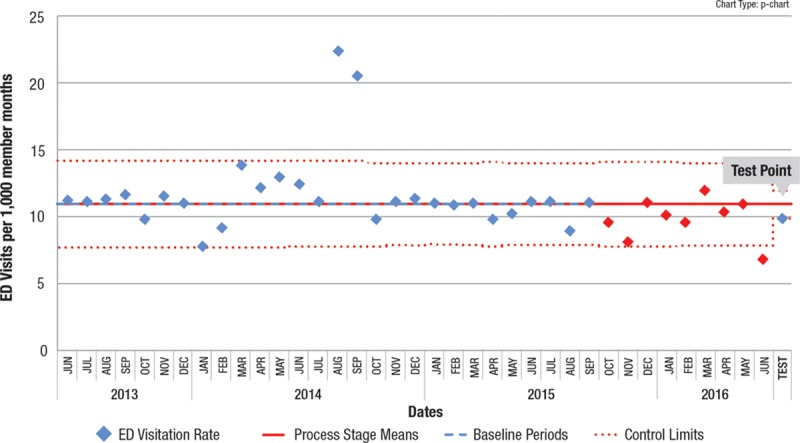
Control chart where the 9 points in red (beginning in October 2015) would not have satisfied the EPR because 8 consecutive points are not below the line, yet the test point of the APR shows special cause, suggesting a centerline shift.

Control chart where the 9 points in red (beginning in October 2015) would not have satisfied the EPR because 8 consecutive points are not below the line, yet the test point of the APR shows special cause, suggesting a centerline shift.