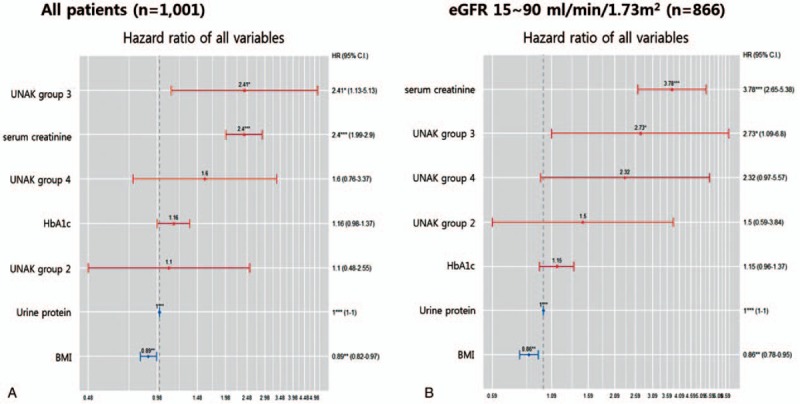
Figure 3.

Cox regression analysis of renal outcomes and risk factors. (A) All patients, (B) patients with eGFR 10–90 mL/min/1.73 m2. BMI = body mass index, CI = confidence interval, eGFR = estimated glomerular filtration rate, HbA1c = glycated hemoglobin, UNAK = urine Na/K.
