Abstract
Objective:
Recent research has shown that combining radiotherapy and immunotherapy can counteract the ability of cancer to evade and suppress the native immune system. To optimise the synergy of the combined therapies, factors such as radiation dose and fractionation must be considered, alongside numerous parameters resulting from the complexity of cancer–immune system interactions. It is instructive to use mathematical models to tackle this problem.
Methods:
In this work, we adapted a model primarily to describe the synergistic effect between single-fraction radiotherapy and immunotherapy (1-methyl tryptophan) observed in previous experiments with glioblastoma-carrying rats. We also showed how the model can be used to generate hypotheses on the outcome of other treatment fractionation schemes.
Results:
The model successfully reproduced the results of the experiments. Moreover, it provided support for the hypothesis that, for a given biologically effective dose, the efficacy of the combination therapy and the synergy between the two therapies are favoured by the administration of radiotherapy in a hypofractionated regime. Furthermore, for a double-fraction irradiation regimen, the synergy is favoured by a short time interval between the treatment fractions.
Conclusion:
It was concluded that the model could be fitted to reproduce the experimental data well within its uncertainties. It was also demonstrated that the fitted model can be used to form hypotheses to be validated by further pre-clinical experiments.
Advances in knowledge:
The results of this work support the hypothesis that the synergetic action of combined radiotherapy and immunotherapy is favoured by using a hypofractionated radiation treatment regimen, given over a short time interval.
Introduction
Glioblastomas are malignant tumours of the central nervous system and belong to the most difficult kinds of tumours to treat at date. The growth of glioblastomas is very invasive, with infiltrating tumour cells spreading far beyond what can be revealed by clinical imaging, counteracting any local therapeutic attempts. Despite substantial technical improvements of radiotherapy (RT), as well as neurosurgery and chemotherapy, few patients survive more than 1–2 years.1 This poor situation is partly due to the propensity of the disease to evade and suppress the host immune system. Tumour evasion and immune suppression occur via the emission of signals that encourage immune tolerance.2 One of the strategies employed by tumour cells involves the bypassing of immune checkpoints, thereby circumventing immune recognition. A noteworthy example is the IDO (indoleamine-2,3-dioxygenase) and tryptophan-2,3-dioxygenase pathway, which metabolises tryptophan resulting in immune tolerance through the recruitment of immune suppressive cells such as myeloid-derived suppressor cells and Tregs (regulatory T cells).2 The IDO-tryptophan-2,3-dioxygenase pathway is especially relevant to the treatment of glioblastoma with 1-methyl tryptophan (1-MT), which is a known inhibitor of IDO activity that has shown beneficial effects on tumour growth in conjunction with other kinds of immunotherapy and chemotherapy in pre-clinical and clinical studies.3–5
Radiation is one of the pillars of modern cancer therapy against many malignancies of the central nervous system.1 In fact, radiation can be a potent partner of immunotherapy because, in addition to deterring tumour progression via the direct induction of DNA damage, it bears immunomodulatory characteristics, and it is now widely anticipated that a co-operation between the two therapies can act synergetically in hindering tumour immune evasion and suppression.2 Pre-clinical trials supporting this view also include the combination of RT and IDO-inhibitory immunotherapy using 1-MT.6, 7 However, the immunomodulatory effects of radiation are complex, and can be both inhibitory or stimulatory. On one hand, radiation possesses immunostimulatory properties, enhancing the emission and presentation of tumour antigens that elicit an immune response.2 On the other hand, the radiosensitivity of lymphocytes is well-established, and this is partly responsible for the general perception of radiation as immunosuppressive.8 These processes depend on the dynamics of the antigen presentation and the immune cells, as well as the evolution of the tumour influenced by immune predation and irradiation, and it is clear that the combined effect depends on the timing of the radiation relative to the administration of immunotherapy. The question of optimum radiation dose and fractionation is, therefore, non-trivial, but nonetheless crucial for the future success of the combination of RT and immunotherapy.9
Consequently, a growing body of research is active in this field, and experimental studies have already given some insight into the problem.9 However, there are practical as well as ethical limits as to how many different fractionation schemes that can be tested in living subjects. Thus, these studies call for mathematical models which can be used to generate hypotheses on treatment efficacy under a range of simulated treatment modalities. Wilkie and Hahnfeldt designed a mathematical model that describes the evolution of a tumour in an immune-cell infiltrated microenvironment.10 Its essence is that the fate of the equilibrium phase of the tumour–immune interaction (escape or elimination) depends on the balance between tumour-regulatory and immunosuppressive signals. This model can be used to simulate treatments of cancer using immunotherapy, and also bears potential for applications to different types of combination therapy.10 The interaction of radiation and the immune system was studied by Walker et al., who developed a mathematical model to simulate the distribution of activated T-cells among metastatic sites, and the effect of radiation on this distribution.11 The objective was to use the model to predict irradiation sites that would maximise a radiation-induced immune-mediated abscopal response. Finally, Kosinsky et al. have recently presented a mathematical model for the combination of RT and immunotherapy, which can be used for simulating various treatment combinations in order to generate hypotheses that subsequently can be tested in an experimental setting.12
In this work, we have adapted a mathematical model from the work of Serre et al. which was originally developed for the combination of RT with anti-PD1 (anti-programmed cell death protein 1) and anti-CTLA4 (anti-cytotoxic T-lymphocyte-associated protein 4) immunotherapy.13 This model was already demonstrated to be able to establish the relevant treatment synergy with only a limited number of adjustable parameters, and in our particular case, we found that the number of free parameters could be reduced even further. The model was, therefore, judged to be quite suitable for the present study, where we apply it on the combination of RT and IDO-inhibitory treatment with 1-MT. Primarily, our aim was to show that the model can be used to describe previously reported data from an experimental rat glioblastoma model. In addition, we intended to explore the capacity of the model to function as a tool for generating hypotheses for other treatment fractionation regimens.
methods and Materials
Experimental data
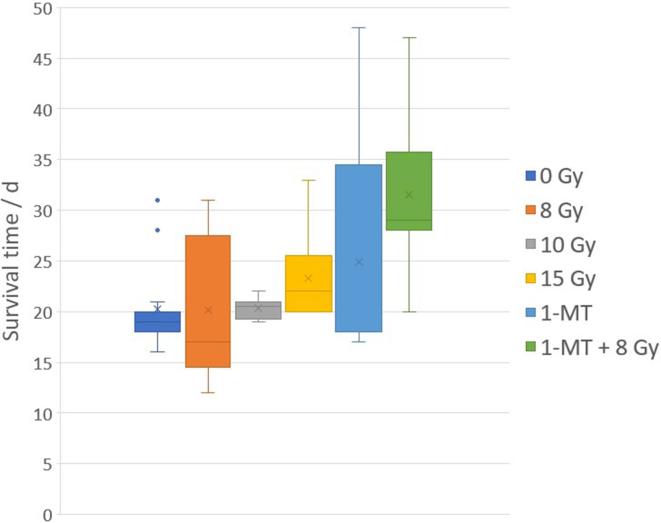
The experimental data used in this work was obtained from two of our previously published pre-clinical treatment studies on Fischer 344 rats carrying intracranial tumours from the syngenic RG2 rat glioma line. The first study was concerned with photon activation therapy using thallium as a dose-enhancing contrast agent.14 In the second study, the animals were treated with a combination of RT and IDO-inhibitory treatments using intraperitoneal injections of 1-MT.7 From these works, we extracted the survival times for animals that were untreated, treated with radiation alone to 8, 10 or 15 Gy, treated with 1-MT alone, or treated with the combination of 1-MT and RT to 8 Gy. All radiation treatments were given in a single fraction. In total, this gave us survival data for 59 animals available for the analysis in this work (Figure 1).
Figure 1.
Pooled survival data for glioma carrying Fischer 344 rats, treated with radiation and/or IDO-inhibitory immunotherapy using 1-MT, showing mean (cross), median (line), interquartile range (box), range (whiskers), and outliers (dots). Data from Ceberg et al14 and Ahlstedt et al.7 1-MT, 1-methyl tryptophan; IDO, indoleamine-2,3-dioxygenase.
Mathematical model
The mathematical model used in this work was adopted with only slight modifications from Serre et al.13 In essence, immunotherapy using 1-MT is assumed to inhibit the tumour’s immunosuppressive properties, while RT stimulates a release of antigens that triggers a recruitment and activation of immune effector cells, and taken together, this results in a combinatory tumoricidal effect. This action is described in more detail below, with reference to Equations 1–6, and illustrated in Figure 2.
Figure 2.
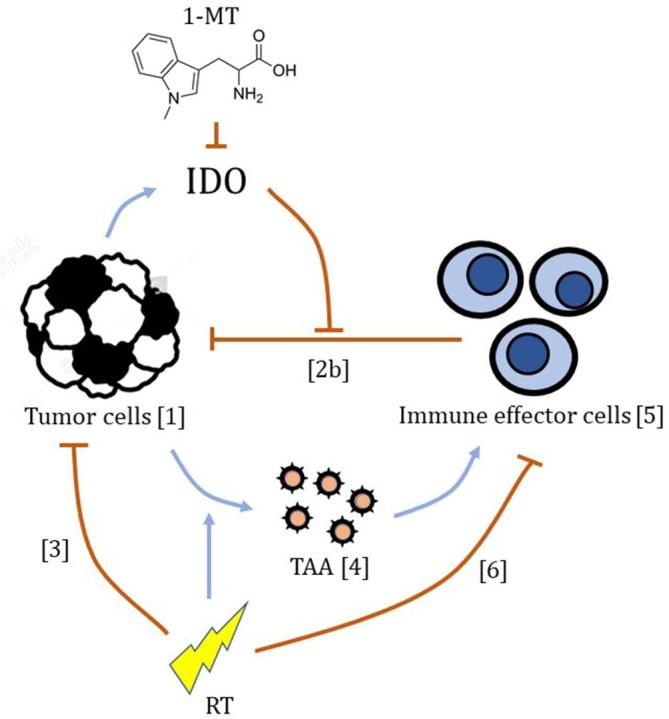
Schematic illustrating the mechanisms of the model relevant to this analysis, with arrows indicating their inhibitory (┤) or stimulatory (→) actions. Numbers in brackets refer to Equations 1-6 listed in the “Methods and Materials” section. 1-MT, 1-methyl tryptophan; IDO, indoleamine-2,3-dioxygenase; RT, radiotherapy; TAA, tumour associated antigens.
The dynamics of the tumour is described by Equation 1, where T is the number of tumour cells, and the change from day n to day is given by an exponential, where μ is the tumour growth rate without any interference with the immune system.
In the presence of an immunological response entailing tumour infiltrating immune effector cells, the growth rate on day n is reduced to μ−Zn. In Serre’s original implementation, the Zn term is given as a sum of a primary and a secondary (memory) component, as described by Equation 2a (omitting the specific effects of anti-PD1 and anti-CTLA4 drugs).13
The primary component is proportional, with a factor , to the number of tumour infiltrating immune effector cells, L, but is also downregulated due to the tumour’s immunosuppressive properties as governed by the parameter . In Equation 2a, this downregulation depends both on the number of tumour cells to the power of 2/3 (corresponding to the surface area of the tumour) and the number of tumour infiltrating immune effector cells. However, given the available experimental data, we found it difficult to obtain a stable fit to these contradictory conditions, and therefore simplified the model to the extremes. On days with no immunotherapy, we assume that the tumour-associated IDO-activity is fully immunosuppressive, which corresponds to an infinitely large . On days with immunotherapy, on the other hand, we assume that the IDO-inhibitory effect of 1-MT cancels this suppressive action completely, which corresponds to setting κ = 0.
The secondary (memory) component in Equation 2a is proportional, with a factor , to the primary component, accumulated from the start of the simulation up to the present day (). In our case, however, we see no long-time survivors, which for the sake of modelling can be interpreted as if the memory effect is insufficient. The secondary component is, therefore, omitted in our study by setting .
Thus, in our implementation, the expression for the tumour growth rate reduction due to the immunological response is reduced to Equation 2b.
On days when radiation treatment is applied, the number of tumour cells in Equation 1 is further decimated by a factor , which is the survival probability for the tumour cells upon exposure to a radiation dose dn, as given in Equation 3 by the standard linear–quadratic model with the parameters and .
In the model, the immune response is triggered by TAA, and Equation 4 describes how the number of antigen molecules changes from day to day . Here, antigen molecules are released by the tumour cells at an intrinsic rate and at an additional radiation induced rate , limited to the fraction of tumour cells that are killed by radiation . The antigen molecules then leave the system at a rate .
Each tumour associated antigen molecule that leaves the system is assumed to activate one immune effector cell. The activated immune effector cells then recede at a rate set by . Thus, the change of the number of tumour infiltrating immune effector cells from day to day is described by Equation 5.
On days when radiation treatment is applied, it is assumed that all present tumour infiltrating immune effector cells are eliminated. This is achieved by setting the survival probability for the immune effector cells , upon exposure to a radiation dose dn, according to Equation 6.
The modified model described above was implemented in a Matlab program, in which Equations 1–6 were calculated iteratively for each day of the simulation in order to study the tumour growth and the survival times for different treatment scenarios. The time period between each iteration is 1 day, which means that all rate parameters are given in units of d−1. The initial number of tumour cells on day 0 was set to in order to mimic the situation in our previous experimental work, where the tumour inoculation consisted of 5000 RG2 cells.7, 14 The initial number of immune effector cells and tumour associated antigen molecules were both set to zero, . The survival time was calculated as the time needed for the tumour mass to reach 100 mg, assuming that the weight of one tumour cell is mg. This value was chosen based on past experience of the RG2 rat glioma model.
Fitting procedure
The values of the model parameters were determined by fitting the model to predict survival times similar to the available experimental survival times, by using the least square method with the lsqnonlin function in Matlab. It was assumed that the parameters associated with the normal immune response were fairly constant, while a larger variation was expected for the parameters associated with the tumour growth and its response to the treatments. In order to minimise the number of free parameters in the fitting procedure, we, therefore, kept the numerical values from the work by Serre et al.13 for the immune effector cell activation and receding rates in Equations 4 and 5, i.e. d−1 and d−1, and consequently, the fitting procedure included only the parameters listed in Table 1.
Table 1. .
Summary of the parameters included in the fitting procedure
| Parameter | Function | Initial estimate | Unit |
| α | Radiation sensitivity | 0.105 | Gy-1 |
| ω | Immune response rate reduction | 0.007 | d-1 |
| μ | Tumour growth rate | 0.535 | d-1 |
| ρ | Intrinsic antigen release rate | 0.1 | d-1 |
| ψ | Radiation induced antigen release rate | 20 | d-1 |
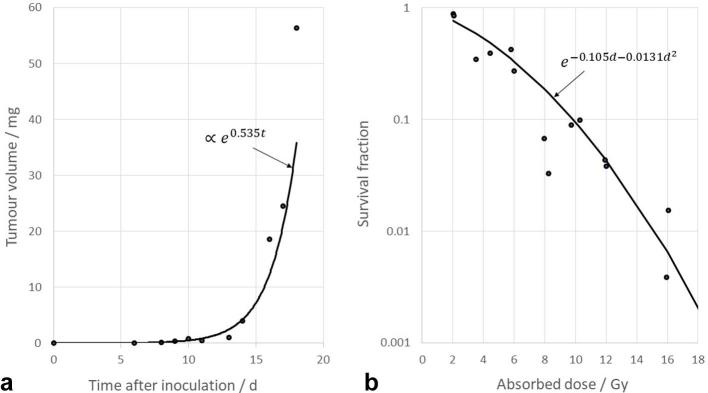
For the intrinsic and radiation-induced antigen release rates, and for the immune response rate reduction, the initial estimates for the fitting procedure were obtained from Serre et al.13 For the tumour growth rate, an initial estimate was obtained by fitting an exponential curve to the experimental data for untreated RG2 glioma-carrying Fischer-344 rats from Aas et al.15 (Figure 3a). In their paper, the tumour size was given in terms of its cross-section area, and for our purpose, its mass was calculated as for a sphere of unit density with the same radius. For the radiation sensitivity, an initial estimate was obtained by fitting the linear quadratic model to the experimental data of Weiszäcker et al. for the survival fraction of RG2 cells after in vivo exposure to radiation,16 assuming a fixed value of 17 Figure 3b.
Figure 3.
(a) The fit of the exponential tumour growth model to the experimental data published by Aas et al.15 (t = time after inoculation), and (b) the fit of the linear–quadratic cell survival model to the experimental data published by Weiszäcker et al.16 (d = absorbed dose).
In order to estimate the variance of the model parameters, the fit was repeated 10,000 times with the data for each experimental treatment group resampled using bootstrapping with replacement.
Simulations
Having fitted the model to the available experimental data, simulations were performed for a range of total biologically effective dose, , and different treatment fractionation schemes, as defined by the number of treatment fractions, , and the time between the fractions. The first treatment fraction was always given on Day 7 of the simulation (corresponding to 7 days post-inoculation in the experimental case), and when immunotherapy was included, 1-MT was administered on Days 7–17. For each fractionation scheme, with and without 1-MT treatment, the simulations were repeated for all 10,000 parameter sets obtained during the fitting procedure, and the mean survival time (MST) and its standard deviation were calculated.
In searching for the maximum synergy between the two treatment modalities, was varied from 10 to 60 Gy, the number of fractions was varied from 1 to 10, and the time between the fractions was varied from 1 to 7 days. For each -level, when RT was given alone, there should be no differences between the survival times for the different fractionation schemes. When the treatments were given in combination, however, it was expected that the survival time could vary with the number of treatment fractions as well as the time between the fractions.
The synergy between immunotherapy using 1-MT and RT was quantified using the therapeutic enhancement ratio (TER) given by:
where is the specific therapeutic effect of treatment modality .18 In our case, the STE was defined as:
where and are the calculated MSTs for the particular treatment and for no treatment, respectively.
Results
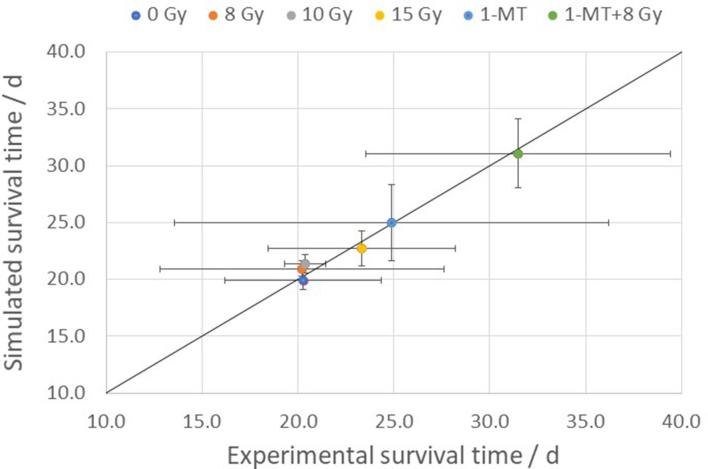
The distribution of the parameter values for all 10,000 fits are shown in Figure 4. All parameters have a distinct peak, and fairly symmetric distributions on a logarithmic scale. As seen from the figure, the mean value of the fitted tumour growth rate is still rather close to the initial value obtained from Aas et al.15 (within about 7%), which implies that the effect of the immune response on the tumour growth is small in the untreated control animals. From the figure, we also see that the mean value of is smaller than the value extracted from the cell culture experiments, meaning that the model predicts a lower cellular radiation sensitivity in order to reproduce the experimental survival times. The goodness of the fit is illustrated by Figure 5, which shows the mean and standard deviations of the simulated vs the experimental survival times for the different treatment scenarios.
Figure 4.
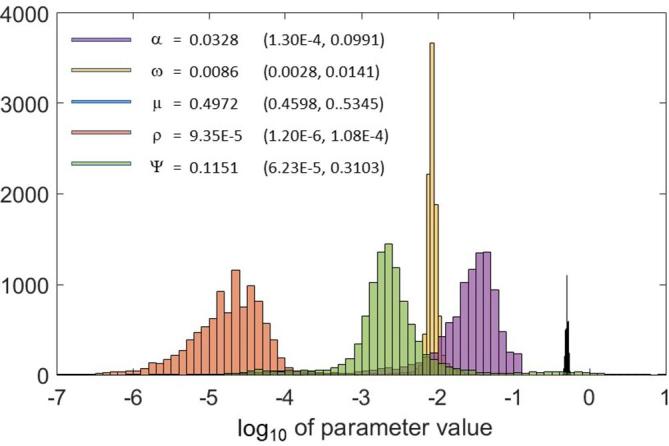
The distribution of the values of the model parameters for all 10,000 fits, together with the mean values and the central 95% interpercentile range.
Figure 5.
Comparison between simulated and experimental mean survival times for the different treatment groups, illustrating the goodness of the fit around the equality line. The error bars indicate one standard deviation.
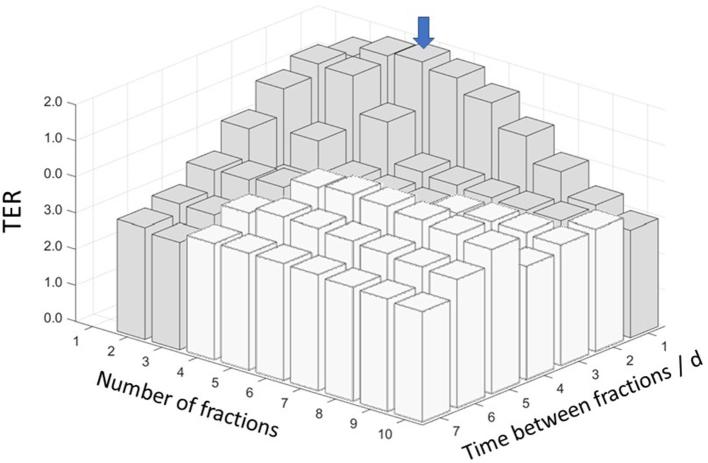
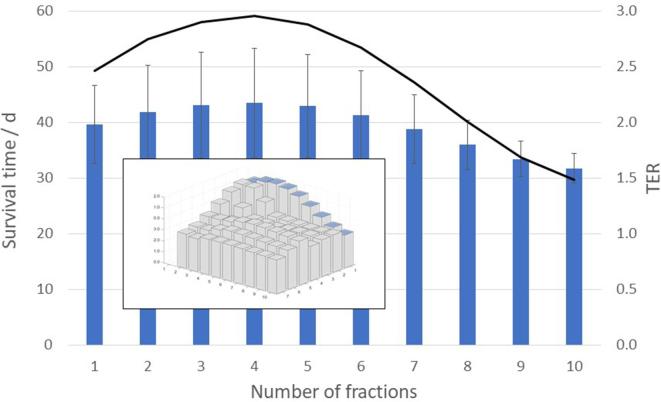
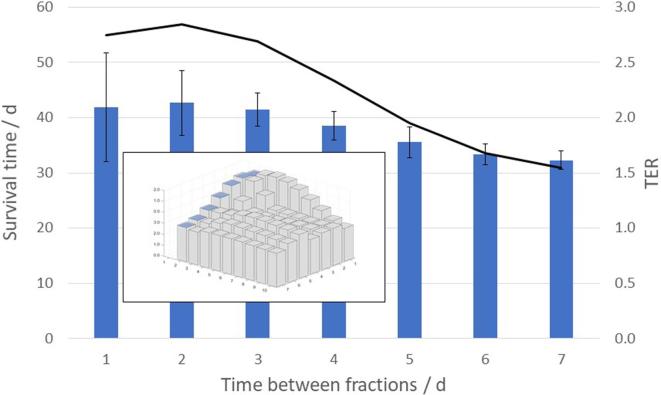
The maximum synergy between the two treatment modalities, as measured by the , was found at , for treatment fractions, and 1 day between the fractions, as shown in Figure 6. At this -level, when RT was given alone, the simulated MST was 22.8 ± 1.6 days (1SD), regardless of the fractionation scheme. For the combined treatments, however, the MST varied with the number of treatment fractions and the time between the fractions, and for the optimal fractionation scheme the mean survival was 43.6 ± 9.8 days (1SD), yielding a . In Figure 7, the mean and standard deviation of the simulated survival times are shown together with the (at ) for different number of treatment fractions from 1 to 10, delivered with 1 day between the fractions. In Figure 8, the mean and standard deviation of the simulated survival times are shown together with the (at ) for treatment fractions delivered with different number of days between the fractions, ranging from 1 to 7.
Figure 6.
The simulated TER-values at BED = 45 Gy for different combinations of number of treatment fractions and time between fractions. The maximum TER value is indicated with a blue arrow. Fractionation schemes protracting beyond the end of the 1-MT delivery are shown as white bars. 1-MT, 1-methyl tryptophan; BED, biologically effective dose; TER, therapeutic enhancement ratio.
Figure 7.
Variation of the simulated mean survival time, with one standard deviation (bars), and the TER (line), with number of treatment fractions, at BED = 45 Gy delivered with 1 day between each fraction. BED, biologically effective dose; TER, therapeutic enhancement ratio.
Figure 8.
Variation of the simulated mean survival time, with one standard deviation (bars), and the TER (line), with number of days between the fractions, at BED = 45 Gy delivered with two treatment fractions. BED, biologically effective dose; TER, therapeutic enhancement ratio.
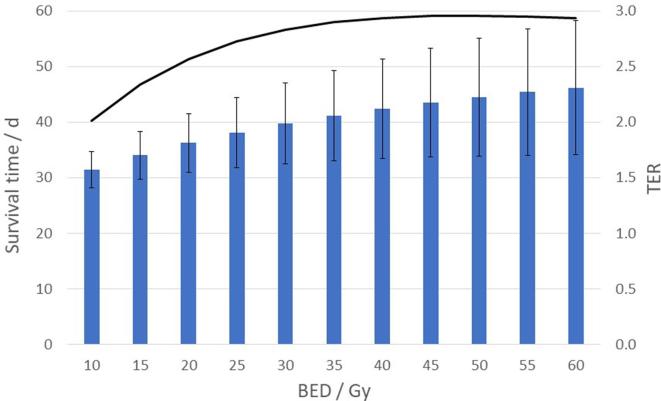
Similar results were obtained at other -levels. Figure 9 shows the mean and standard deviation of the simulated survival times together with the for different -levels from 10 Gy to 60 Gy, for treatment fractions, and 1 day between the fractions. While the survival time continues to improve with increasing , it can be seen that the synergy of the combination with immunotherapy (in terms of ) reaches a maximum at .
Figure 9.
Variation of the simulated mean survival time, with one standard deviation (bars), and the TER (line), with BED, delivered in four treatment fractions with 1 day between each fraction. BED, biologically effective dose; TER, therapeutic enhancement ratio.
Discussion
In this work, we have applied the mathematical model developed by Serre et al.13 to describe the experimental data from preclinical experiments with radiotherapy and immunotherapy as previously reported by us.7, 14 While the original model was designed to describe the specific effects of anti-PD1 and anti-CTLA4 treatments, the experimental data used in this study pertained to IDO-inhibitory treatments using 1-MT. With only slight modifications, the model could be fitted to the experimental data with good agreement, as demonstrated in Figure 5.
In the fitting procedure, the model parameters were determined using a fixed value of = 8 Gy. This estimate was based on the study on the clinical radiobiology of glioblastoma multiforme by Pedicini et al. in which the -ratio was determined to 8 Gy, with a 95% confidence interval of 5–10.8 Gy based on 559 patients.17 However, as there is no strong reason to believe that this value would be the same in our animal model, we studied the effect of the choice of the -ratio by repeating the entire fit and all subsequent simulations using = 6 Gy and = 10 Gy. As the fitting procedure forced the model to fit the experimental data, the changed -ratio was compensated by slight adjustments of the model parameters, mainly by the -parameter, which increased as the -parameter was forced to decrease, and vice versa. The tumour growth rate was unaffected, and the remaining parameters (i.e. , and ψ ) were within 5% from their value at = 8 Gy. Consequently, the results of the simulations were not much affected by the change of -ratio; all simulated survival times remained within 0.5%.
It is important to note, that the model has only been fitted to a very limited set of data, and that it needs to be validated by further experiments. While the model successfully captures the observable outcomes, its components cannot be expected to accurately describe the underlying processes. Although some observations could be made regarding the numerical values of the fitted parameters (i.e. and , as compared to their initial values obtained from previous studies), this should not overinterpreted, and for other parameters there were not as much pre-existing experience. Thus, extrapolations using the fitted model should be made with great care.
In principle, however, the fitted model could well be used to simulate any other scenarios involving the combination of 1-MT treatments and fractionated RT. In particular, we have in this work simulated the use of various RT fractionation schemes, and we have provided some examples pertaining to the important issue of choosing the most effective number of fractions and time interval between the fractions. In order to minimise the influence of the choice of the -ratio on the results, we compared treatment fractionation schemes producing the same (since when radiation is given alone to a constant -level, the survival time is the same for all fractionation schemes, regardless of the value of the -ratio). For the combined treatments, the results for the range of -levels considered here suggest the existence of an optimal number of fractions, which maximises the survival time as well as the synergy between the two treatment modalities (as measured in terms of ). The results also indicate that the survival time and the is a function of time between the treatment fractions. Based on the simulations performed in this work, the optimal fractionation scheme was four fractions given with 1 day between each fraction, possibly except for the case of treatments delivered in two fractions. The existence of an optimum number of treatment fractions can be explained based on the model equations. From there it can be seen, that while the radiation induced amount of tumour antigens increases with the number of fractions, at the same time, the growth of the number of activated effector cells is delayed due to increased radiation killing. As a consequence, these two competing processes result in an optimum with respect to the effect on the tumour growth and thereby the survival time as it is defined here.
The fact that improved treatment efficacy was seen for a small number of fractions, though larger than 1, is in agreement with published data for other combinations of immune treatments and RT. Experience from previous pre-clinical and clinical studies seems to suggest that the synergetic effect is generally favoured by hypofractionated RT.9, 19 On the other hand, more recent results indicate that a small number of fractions may be better than a single fraction.20, 21 Wider conclusions regarding the optimal therapy are difficult to draw considering the varying results in preclinical studies with different immune therapies, tumour types, and tumour sites.22 More in-depth investigations in preclinical and clinical settings is therefore motivated for specific diseases and disease models.
The model’s sensitivity to RT fractionation may also depend on the inherent kinetics of the antigens and immune effector cells. In this work, we kept the numerical values of the parameters and as they had been determined by Serre et al.13 It was not possible, at this stage, to include these parameters in the fit, since we only had data available for treatments using single-fraction RT. In our continued work, however, we will attempt to determine these parameter values as well, based on input from additional experimental data. The next step in our research on this topic is, therefore, to set up experiments with multiple fractions. In this way, it is anticipated that the model can be improved by generating hypotheses that can be tested experimentally, and modifying it based on the results in an iterative cycle.
Conclusion
In this work, we have demonstrated that the model adapted from Serre et al.13 can be used to describe experimental data on the combination of single-fraction radiation therapy and immunotherapy (1-MT) in a pre-clinical glioblastoma setting, which was our primary purpose. The model successfully predicted a synergistic effect between the two therapies, as observed in pre-clinical experiments previously reported by us,7, 14 well within the experimental uncertainties. Based on the fitted model, our simulations predicted the existence of an optimum number of fractions, with a higher treatment efficacy and a more pronounced synergy. In our particular case, this optimum was achieved when radiation was given in four fractions, with 1 day between each fraction. Furthermore, the model provided that, in a two-fraction irradiation scheme, the synergy was improved by small fraction intervals, and that it decreased with increasing intervals. It should be emphasised, however, that the model was fitted to a limited amount of experimental data. Given this limitation, the latter part of the findings of this work shows that the model can be used to form hypotheses to be validated by further pre-clinical experiments.
Footnotes
Acknowledgements: The authors acknowledge the financial support from the Sten K Johnson Foundation and the Gunnar Nilsson Cancer Foundation.
Contributor Information
Arthur Chakwizira, Email: arthur.chakwizira.135@student.lu.se.
Jonatan Ahlstedt, Email: jonatan.ahlstedt@med.lu.se.
Henrietta Nittby Redebrandt, Email: henrietta.nittby@med.lu.se.
Crister Ceberg, Email: crister.ceberg@med.lu.se.
REFERENCES
- 1.Stupp R, Mason WP, van den Bent MJ, Weller M, Fisher B, Taphoorn MJ, et al. . Radiotherapy plus concomitant and adjuvant temozolomide for glioblastoma. N Engl J Med 2005; 352: 987–96. doi: 10.1056/NEJMoa043330 [DOI] [PubMed] [Google Scholar]
- 2.Sahebjam S, Sharabi A, Lim M, Kesarwani P, Chinnaiyan P. Immunotherapy and radiation in glioblastoma. J Neurooncol 2017; 134: 531–9. doi: 10.1007/s11060-017-2413-0 [DOI] [PubMed] [Google Scholar]
- 3.Miyazaki T, Moritake K, Yamada K, Hara N, Osago H, Shibata T, et al. . Indoleamine 2,3-dioxygenase as a new target for malignant glioma therapy. Laboratory investigation. J Neurosurg 2009; 111: 230–7. doi: 10.3171/2008.10.JNS081141 [DOI] [PubMed] [Google Scholar]
- 4.Perng P, Lim M. Immunosuppressive mechanisms of malignant gliomas: parallels at non-CNS sites. Front Oncol 2015; 5: 153. doi: 10.3389/fonc.2015.00153 [DOI] [PMC free article] [PubMed] [Google Scholar]
- 5.Moon YW, Hajjar J, Hwu P, Naing A. Targeting the indoleamine 2,3-dioxygenase pathway in cancer. J Immunother Cancer 2015; 3: 51. doi: 10.1186/s40425-015-0094-9 [DOI] [PMC free article] [PubMed] [Google Scholar]
- 6.Monjazeb AM, Grossenbacher SK, Sckisel GD, Canter R, Sparger EE, Culp W, et al. . Combined radiotherapy and immunotherapy using CPG oligodeoxynucleotides and indolamine 2,3 dioxygenase (IDO) blockade. J Immunother Cancer 2013; 1(Suppl 1): P256. doi: 10.1186/2051-1426-1-S1-P256 [DOI] [Google Scholar]
- 7.Ahlstedt J, Förnvik K, Ceberg C, Nittby HR. Effect of blockade of indoleamine 2,3-dioxygenase in conjunction with single fraction irradiation in rat glioma. J Rad Oncol 2015; 2: 22. [Google Scholar]
- 8.Roses RE, Datta J, Czerniecki BJ. Radiation as immunomodulator: implications for dendritic cell-based immunotherapy. Radiat Res 2014; 182: 211–8. doi: 10.1667/RR13495.1 [DOI] [PMC free article] [PubMed] [Google Scholar]
- 9.Kalbasi A, June CH, Haas N, Vapiwala N. Radiation and immunotherapy: a synergistic combination. J Clin Invest 2013; 123: 2756–63. doi: 10.1172/JCI69219 [DOI] [PMC free article] [PubMed] [Google Scholar]
- 10.Wilkie KP, Hahnfeldt P. Tumor-immune dynamics regulated in the microenvironment inform the transient nature of immune-induced tumor dormancy. Cancer Res 2013; 73: 3534–44. doi: 10.1158/0008-5472.CAN-12-4590 [DOI] [PMC free article] [PubMed] [Google Scholar]
- 11.Walker R, Schoenfeld JD, Pilon-Thomas S, Poleszczuk J, Enderling H. Evaluating the potential for maximized T cell redistribution entropy to improve abscopal responses to radiotherapy. Converg Sci Phys Oncol 2017; 3: 034001. doi: 10.1088/2057-1739/aa7269 [DOI] [PMC free article] [PubMed] [Google Scholar]
- 12.Kosinsky Y, Dovedi SJ, Peskov K, Voronova V, Chu L, Tomkinson H, et al. . Radiation and PD-(L)1 treatment combinations: immune response and dose optimization via a predictive systems model. J Immunother Cancer 2018; 6: 17. doi: 10.1186/s40425-018-0327-9 [DOI] [PMC free article] [PubMed] [Google Scholar]
- 13.Serre R, Benzekry S, Padovani L, Meille C, André N, Ciccolini J, et al. . Mathematical modeling of cancer immunotherapy and its synergy with radiotherapy. Cancer Res 2016; 76: 4931–40. doi: 10.1158/0008-5472.CAN-15-3567 [DOI] [PubMed] [Google Scholar]
- 14.Ceberg C, Jönsson BA, Prezado Y, Pommer T, Nittby H, Englund E, et al. . Photon activation therapy of RG2 glioma carrying Fischer rats using stable thallium and monochromatic synchrotron radiation. Phys Med Biol 2012; 57: 8377–91. doi: 10.1088/0031-9155/57/24/8377 [DOI] [PubMed] [Google Scholar]
- 15.Aas AT, Brun A, Blennow C, Strömblad S, Salford LG. The RG2 rat glioma model. J Neurooncol 1995; 23: 175–83. doi: 10.1007/BF01059948 [DOI] [PubMed] [Google Scholar]
- 16.Weizsäcker M, Nagamune A, Winkelströter R, Vieten H, Wechsler W. Radiation and drug response of the rat glioma RG2. Eur J Cancer Clin Oncol 1982; 18: 891–5. doi: 10.1016/0277-5379(82)90200-0 [DOI] [PubMed] [Google Scholar]
- 17.Pedicini P, Fiorentino A, Simeon V, Tini P, Chiumento C, Pirtoli L, et al. . Clinical radiobiology of glioblastoma multiforme. Strahlentherapie und Onkologie 2014; 190: 925–32. doi: 10.1007/s00066-014-0638-9 [DOI] [PubMed] [Google Scholar]
- 18.Persson BRR, Bauréus Koch C, Grafström G, Ceberg C, Munck af Rosenschöld P, Nittby H, et al. . “Abscopal” effect of radiation therapy combined with immune-therapy using IFN-γ gene transfected syngeneic tumor cells, in rats with bilateral implanted N29 tumors. ISRN Immunology 2011; 2011: 1–13. doi: 10.5402/2011/230130 [DOI] [Google Scholar]
- 19.Ceberg C, Persson BRR. Co-operative radio-immune-stimulating cancer therapy. TCR 2013; 9: 87–108. [Google Scholar]
- 20.Vanpouille-Box C, Alard A, Aryankalayil MJ, Sarfraz Y, Diamond JM, Schneider RJ, et al. . DNA exonuclease Trex1 regulates radiotherapy-induced tumour immunogenicity. Nat Commun 2017; 8: 15618. doi: 10.1038/ncomms15618 [DOI] [PMC free article] [PubMed] [Google Scholar]
- 21.Dewan MZ, Galloway AE, Kawashima N, Dewyngaert JK, Babb JS, Formenti SC, et al. . Fractionated but not single-dose radiotherapy induces an immune-mediated abscopal effect when combined with anti-CTLA-4 antibody. Clin Cancer Res 2009; 15: 5379–88. doi: 10.1158/1078-0432.CCR-09-0265 [DOI] [PMC free article] [PubMed] [Google Scholar]
- 22.Gandhi SJ, Minn AJ, Vonderheide RH, Wherry EJ, Hahn SM, Maity A. Awakening the immune system with radiation: optimal dose and fractionation. Cancer Lett 2015; 368: 185–90. doi: 10.1016/j.canlet.2015.03.024 [DOI] [PubMed] [Google Scholar]


