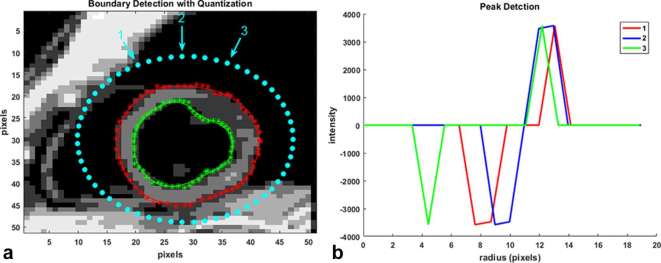
Figure 1.
(a) Boundary detection with the 3D semi-automated technique starts with a bounding ellipse (outer dotted ellipse) that locates points on the myocardial boundaries based on pixelwise intensity gradients in an inwards, radial direction. Detection starts with the quantized reference image at end-diastole and is continued based on phase-unwrapped displacement information in subsequent timeframes. Dotted red line is the semi-automated epicardial contour before applying the LOESS curve fitting technique and starred red line is the one after the LOESS fit. Dotted green line is the pre-LOESS fit semi-automated endocardial contour and starred green line is the one after the LOESS fit. (b) Examples of pixel intensity-based gradients in the radial direction whose peaks are used to locate epicardial and endocardial boundary points. 3D, three-dimensional.

