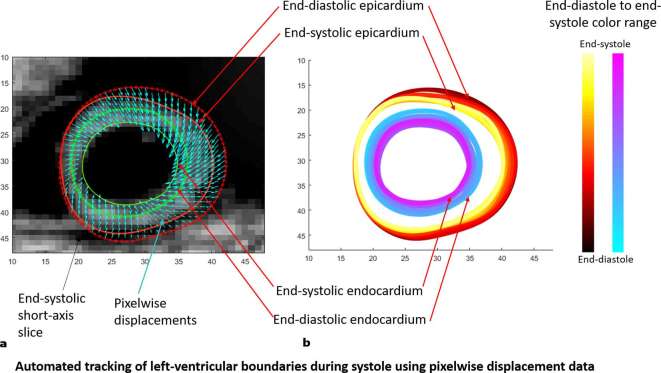
Figure 6. .
(a) The end-systolic boundaries (solid red and green lines) shown in comparison to the end-diastolic boundaries (dotted red and green lines). Finding a control point’s motion at each timeframe occur by tracking pixels with displacements (shown in cyan), whose tails map back to an original boundary control point at end-diastole. (b) Morphology of the two myocardial boundaries between end-diastole and end-systole using the 3D semi-automated methodology.

