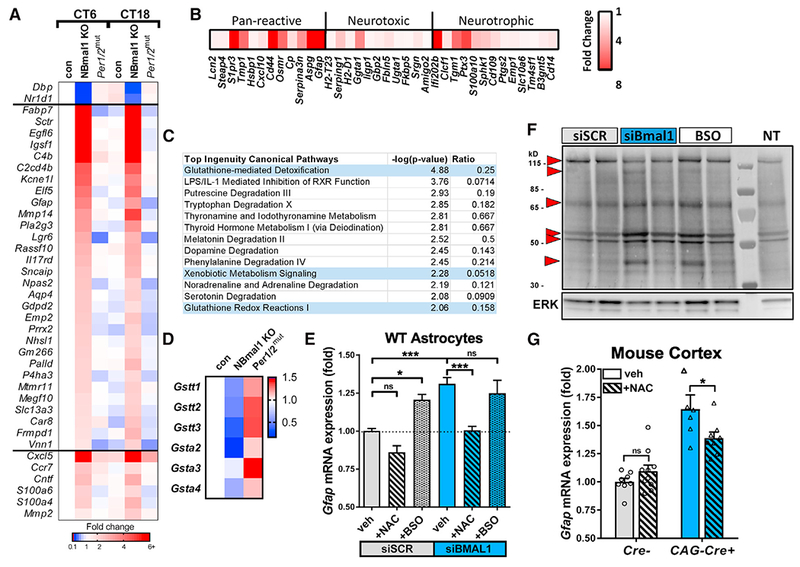
Figure 3. BMAL1 Regulates Astrocyte Activation via a Glutathionylation-Dependent Mechanism.

(A) Astrocyte-specific genes upregulated in Nestin-Cre+;Bmal1f/f(NBmal1 KO) cortexand changes to the same genes in Per1/2mut mice. Transcripts upregulated at least 2-fold in NBmal1 KO were compared to the top 200 astrocyte-specific genes (Zhang et al., 2014), and overlapping genes are displayed. Other notable genes implicated in astrocyte activation and function were upregulated in NBmal1 KO cortex (bottom). The clock-controlled genes Dbp and Nr1d1 are direct Bmal1 transcriptional targets.
(B) Expression of neurotoxic, neurotrophic, and pan-reactive astrocyte activation genes (Liddelow et al., 2017) in 5-month-old global Bmal1 KO versus WT littermate hippocampus assayed by microfluidic qPCR. Each data point represents the average of 4 Bmal1 KO mice normalized to the average of 4 WT littermates.
(C) Results from Ingenuity Pathway Analysis canonical pathway analysis of NBmal1 KO microarray data. Pathways related to glutathione homeostasis are colored blue.
(D) Expression levels for downregulated glutathione-S-transferases in NBmal1 KO cortex versus Bmal1f/fcontrols. Expression levels in Per1/2mut cortex included for comparison (based on microarray data).
(E) qPCR illustrating effect of glutathione manipulation on Gfap transcript levels following Bmal1 knockdown. WT primary astrocytes treated with control siRNA (siSCR, gray bars) or siBmal1 (blue bars), with or without N-acetyl-cysteine (NAC; striped bars) to increase glutathione levels, or buthionine sulfoxime (BSO; speckled bars) to deplete glutathione. n = 9 samples/condition from 3 separate experiments.
(F) WT astrocytes transfected with siSCR, siBmal1, or siSCR +BSO (BSO) were treated with biotin-linked glutathione ethyl ester (bioGEE) to assess glutathionylation. Increased band intensity indicates decreased endogenous glutathionylation. Arrows denote altered bands. NT, not treated with bioGEE, showing nonspecific labeling.
(G) qPCR depicting effects of NAC treatment on Gfap transcript levels in cortex of inducible Bmal1 KO mice (CAG-CreERT2+;Bmal1f/f). Inducible Bmal1 KO mice and Cre− control littermates were treated with NAC before, during, and after 5-day tamoxifen treatment to delete Bmal1. Mice were harvested 9 days after the start of tamoxifen. n = 6–10 mice per group.
All data represent mean + SEM. *p < 0.05, ***p < 0.001 by t test with Holm-Sidak correction for multiple comparisons.
