. 2018 Oct 31;27(5):408–418. doi: 10.5607/en.2018.27.5.408

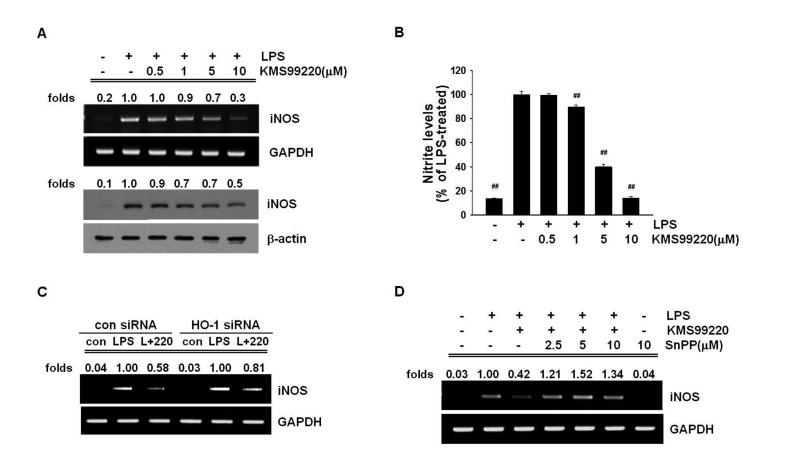
Fig. 4. KMS99220 suppresses iNOS expression via HO-1 induction. (A, B) BV2 cells were exposed to various concentrations of KMS99220 with 0.2 µg/ml LPS. (A) The cells were harvested after 6 or 24 h, and RT-PCR or western blot analysis was performed against iNOS, respectively. (B) After 24 h, the cell culture medium was subjected to NO determination by the Griess method. The data are expressed as % of LPS-treated control±SEM; ##p<0.01. (C) After transfection with control or HO-1 siRNA for 24 h as described for Fig. 3, the cells were treated with 10 µM KMS99220 or 0.2 µg/ml LPS for 6 h. RT-PCR was performed against iNOS using GAPDH as a loading control. (D) BV2 cells were preincubated with SnPP for 1 h, and treated with 10 µM KMS99220 and/or 0.2 µg/ml LPS for 6 h. The mRNA level of iNOS was determined by RT-PCR. For quantitative analysis (A, C, and D), values obtained from densitometry were normalized against respective loading controls (GAPDH or β-actin) and expressed as fold of respective LPS-treated control.

Fig. 4