. 2018 Oct 8;27(5):419–436. doi: 10.5607/en.2018.27.5.419

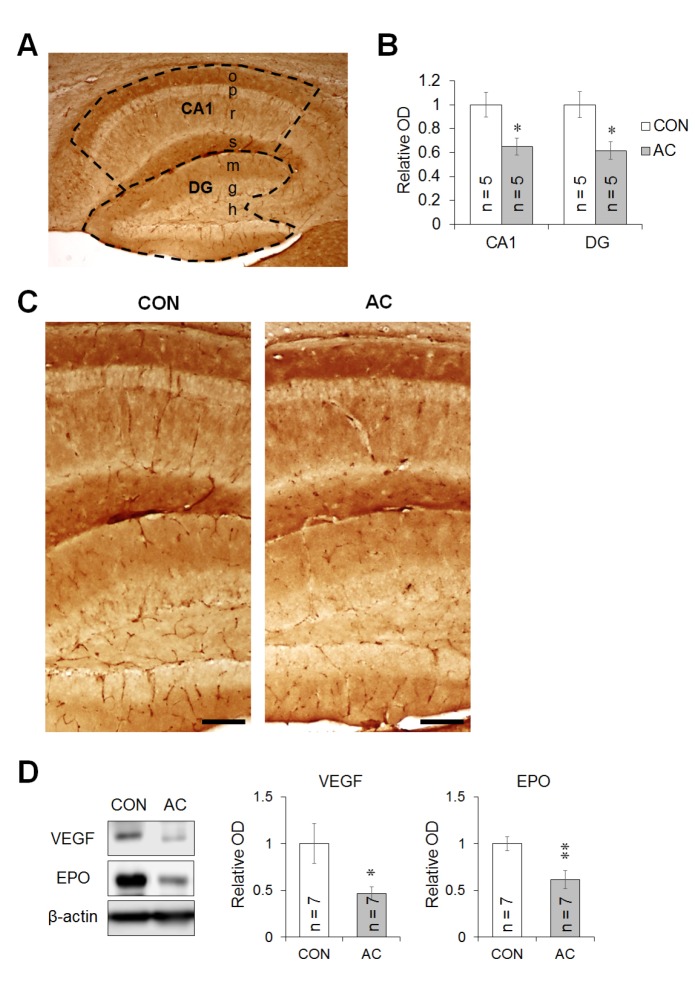
Fig. 7. AC affected the vascular network in the hippocampus. (A) Schematic diagram showing the hippocampal subdivision for intensity measurement (CA1 and DG). (B) Quantification of the vWF-positive fractional vascular area in the CA1 and DG. Results are expressed as the relative OD of the CA1 and DG occupied by blood vessels. (C) Representative microphotographs of the CA1 and DG immunostained for vWF. The expression level of vWF-positive cells in the CA1 and DG were significantly decreased 4 weeks after AC treatment. Scale bar corresponds to 100 µm. (D) Changes in protein levels of VEGF and EPO in the mouse hippocampus after AC injection. Immunoblots were evaluated by measuring the OD, and the signals were normalized to β-actin. Animals in the AC group showed lower blood vessel density and VEGF and EPO protein levels than vehicle-treated group. Data are expressed as means±SEs. *p<0.05, **p<0.01 vs. vehicle-treated controls.

Fig. 7