. 2018 Oct 8;27(5):419–436. doi: 10.5607/en.2018.27.5.419

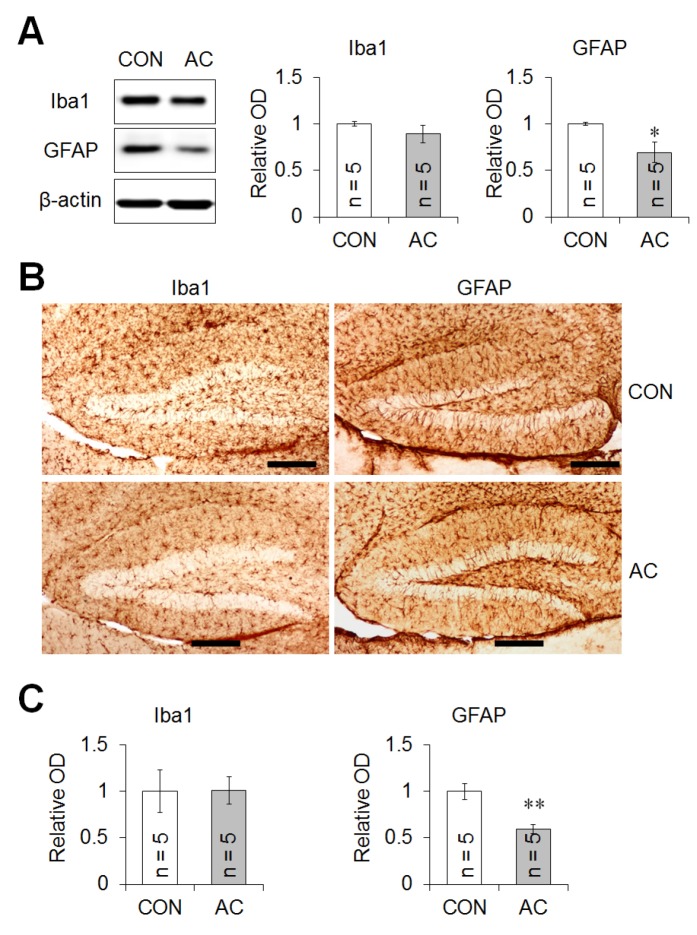
Fig. 8. AC treatment did not up-regulate the levels of certain glial cell proteins. (A) Immunoblots of Ibal and GFAP were evaluated by measuring ODs, and the signals normalized to those of β-actin. (B) Representative microphotographs of the DG immunostained for Ibal and GFAP. Scale bar: 200 µm. (C) Quantification of Iba1- and GFAP-positive fractional areas in the DG. The results are expressed as relative ODs. AC treatment did not affect Iba1 protein levels, but decreased GFAP protein levels in immunoblots, consistent with the immunohistochemical results. Data are expressed as means±SEs. *p<0.05, **p<0.001 vs. vehicle-treated controls.

Fig. 8