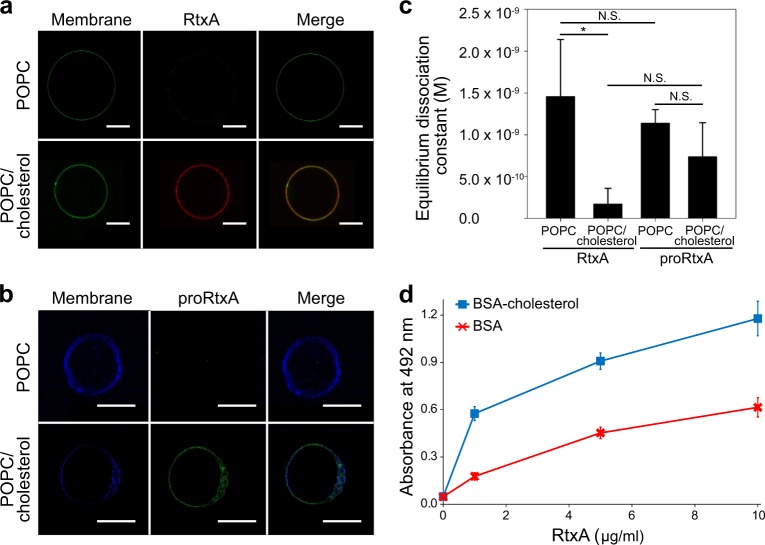
Fig. 6. Cholesterol increases membrane binding of RtxA and proRtxA.
a RtxA labeled with AF555 (red) was incubated with GUVs composed of either 100% POPC or 75% POPC and 25% cholesterol, labeled with NBD-PE (green) for 30 min. b proRtxA labeled with Dy495 (green) was incubated with GUVs composed of either 100% POPC or 75% POPC and 25% cholesterol, labeled with Marina Blue (blue) for 30 min. c RtxA and proRtxA binding to POPC and POPC/cholesterol membranes was analyzed by SPR. The equilibrium dissociation constant (KD) was measured for RtxA and proRtxA binding to 100% POPC or 75% POPC and 25% cholesterol membranes by determining the association and dissociation rate constants of each interaction (Supplementary Table 4). *p < 0.05; N.S., not significant. d Wells of a 96-well plate were coated with 10 μg/ml of cholesterol-BSA or free BSA, which were subsequently incubated with different concentrations of purified RtxA that was detected with the mAb 9D4. Each point represents the mean value ± SD of three independent determinations performed in duplicate

