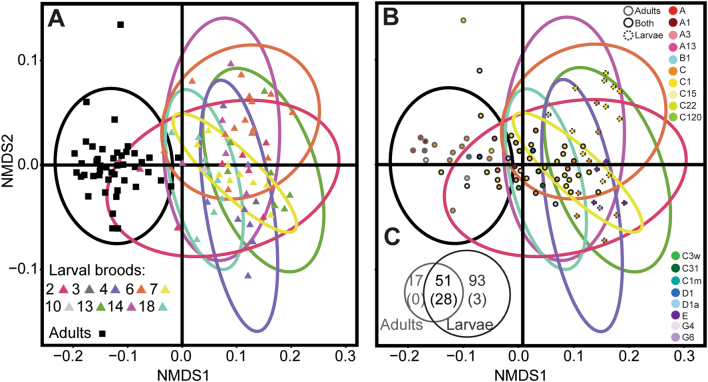
Fig. 1.
Nonmetric multidimensional scaling (NMDS) Split Biplot, based on a Bray–Curtis distance matrix of variance-normalized OTU abundances and sequence similarity between OTUs (pairwise percent identities), illustrating differences between Symbiodinium communities associated with adult colonies and larvae of the brooding coral Seriatopora hystrix (ShA) based on parentage analysis. Ellipses encircling symbols of the corresponding color represent 95% probability regions for adults (black) and larval broods (colored), where each brood represents all larvae sharing the same dam (color-coded). Samples and OTUs have been separated to increase Biplot clarity whilst maintaining ellipse positions to facilitate comparisons of ordination space between samples and OTU positions. a Each point represents the Symbiodinium community associated with a unique coral adult or larval sample. b Each point represents an OTU colored by type level. Only 83 of the 161 OTUs are shown, representing those OTUs with the greatest taxonomic confidence (see Table S7 for full names and selection criteria). Outlining around each point represents the origin of the OTU, i.e., those found uniquely in adult (gray outline) or larval (broken gray outline) samples, or retrieved from both (black outline). Samples presented in a and OTUs presented in b share the same ordination space but were separated for clarity. c Venn diagram, illustrating the number of Symbiodinium OTU’s that were unique to larvae (dark gray text) versus adults (light gray text). The number of OTUs that were significant after p-adjustments are in parentheses. Ellipses corresponding to dams 3 and 10 are not represented, as only one larva per dam was collected and sequenced

