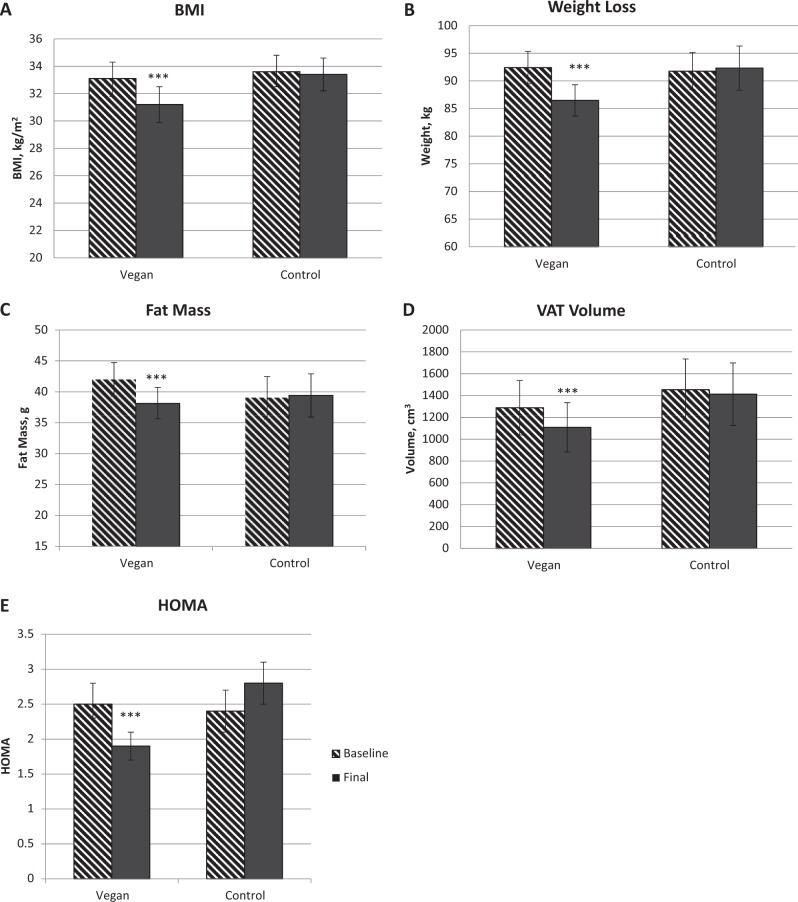
Fig. 2.
Changes in body weight, fat mass, and insulin resistance in the vegan and control group at baseline and after 16 weeks. (A) Body Mass Index (BMI), Gxt p < 0.001; (B) Body Weight, Gxt p < 0.001; ; (C) Fat Mass, Gxt p < 0.001; (D) Visceral Fat Volume, Gxt p < 0.001; and (E) Homeostatic Model Assessment Insulin Resistance (HOMA-IR), Gxt p=0.004. Gxt is interaction between group and time from the ANOVA model. *** for p < 0.001. Data are given as means with 95% confidence intervals

