FIGURE 2.

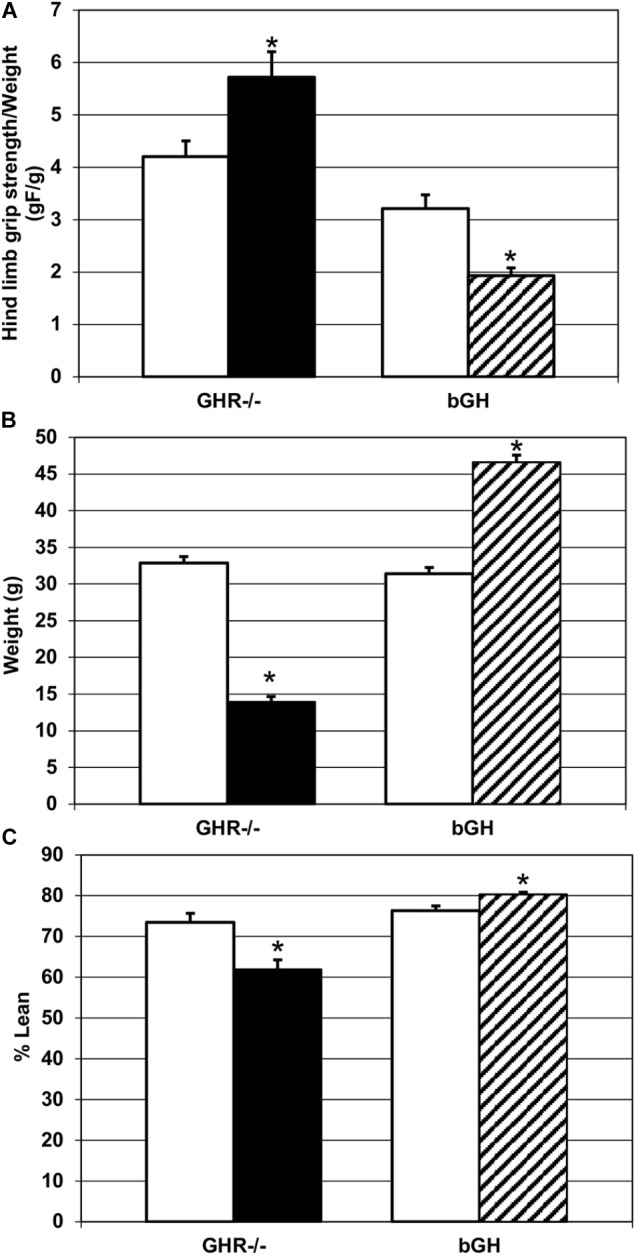
Changes in strength and phenotype. (A) Quantification of hind limb grip strength in each experimental group. GHR-/- mice (n = 9) were significantly stronger than controls (n = 7), and bGH mice (n = 7) were significantly weaker than controls (n = 5), ∗p < 0.05. (B) Quantification of body weight change in each experimental group. GHR-/- mice (n = 9) weighed significantly less than controls (n = 7) and bGH mice (n = 7) weighed significantly more than controls (n = 5), ∗p < 0.05. (C) Quantification of percent lean mass change in each experimental group. GHR-/- mice (n = 9) had significantly reduced percent lean mass, compared to controls (n = 7), and bGH mice (n = 7) had significantly increased percent lean mass, compared to controls (n = 5), ∗p < 0.05.
