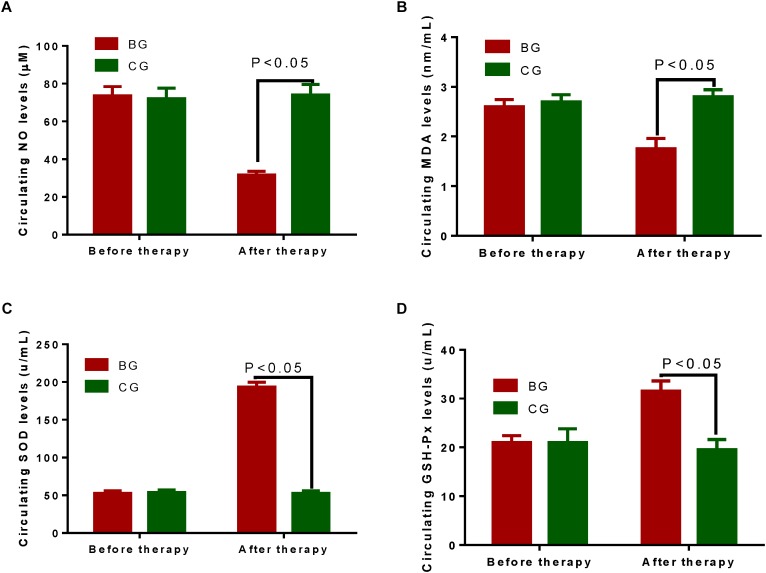
FIGURE 3.
Circulating antioxidant levels between two groups. (A) Circulating levels of NO between two groups. (B) Circulating levels of MDA between two groups. (C) Circulating levels of SOD between two groups. (D) Circulating levels of GSH-PX between two groups. The statistical difference was significant if P < 0.05.

