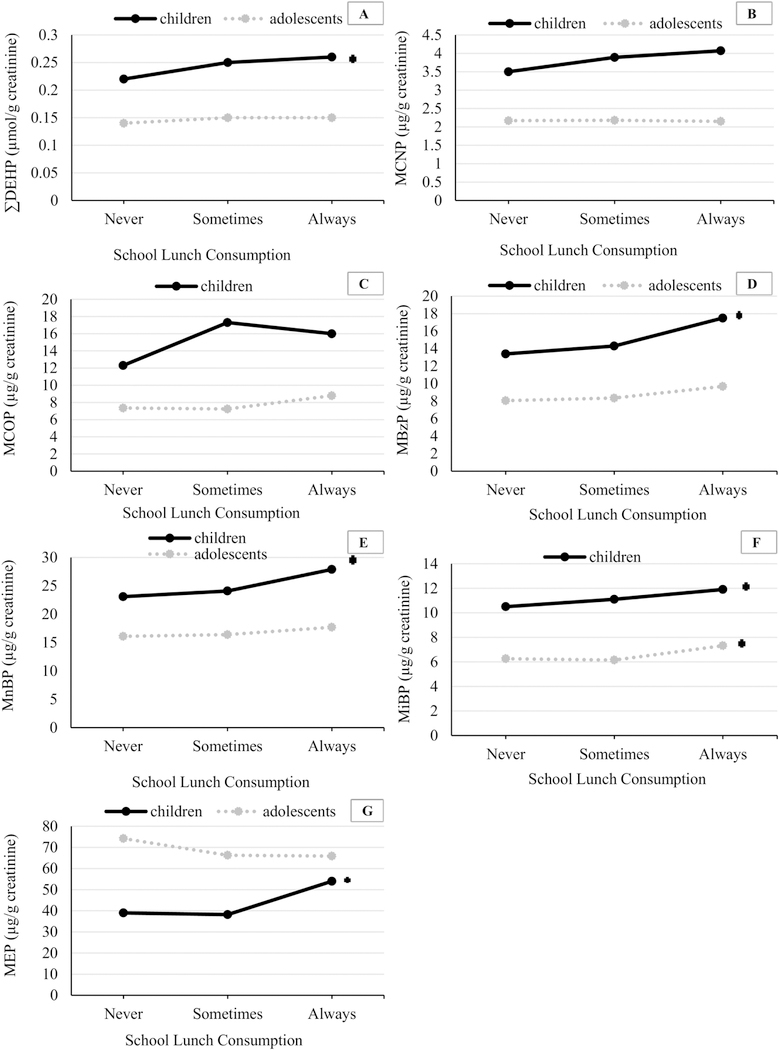
Figure 1.

Median urinary phthalate metabolite concentrations (µg/g creatinine) in children (ages 6–11) and adolescents (ages 12–19) by school lunch consumption category.
Footnote: In children: n (Never) were: 184, for MCNP and MCOP, and 217 for the rest of the urinary metabolites; n (Sometimes) were: 278 for MCNP and MCOP, and 334 for the rest of the urinary metabolites; n (Always) were: 1407 for MCNP and MCOP, 1644 for the rest of the urinary metabolites. In adolescents: n (Never) were: 392 for MCNP and MCOP, and 527 for the rest of the urinary metabolites; n (Sometimes) were: 339 for MCNP and MCOP, and 471 for the rest of the urinary metabolites; n (Always) were: 1049 for MCNP and MCOP, and 1316 for the rest of the urinary metabolites. *significant p trend – Models adjusted for urinary creatinine (continuous, ln-transformed)
