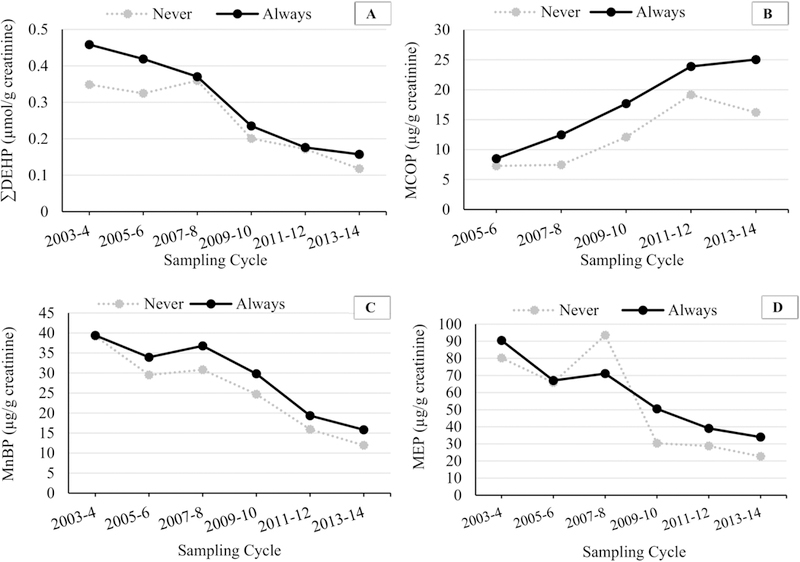
Figure 2.

Median urinary phthalate metabolite concentrations (µg/g creatinine) in children (ages 6–11) by school lunch consumption category over time.
Footnote: MCOP was not measured in the 2003–2004 sampling cycle. n (Never) were: 33 (2003–4), 33 (2005–6), 25 (2007–8), 35 (2009–10), 37 (2011–12), 54 (2013–14). n (Always) were: 237 (2003–4), 259 (2005–6), 299 (2007–8), 305 (2009–10), 271 (2011–12), 273 (2013–14)
