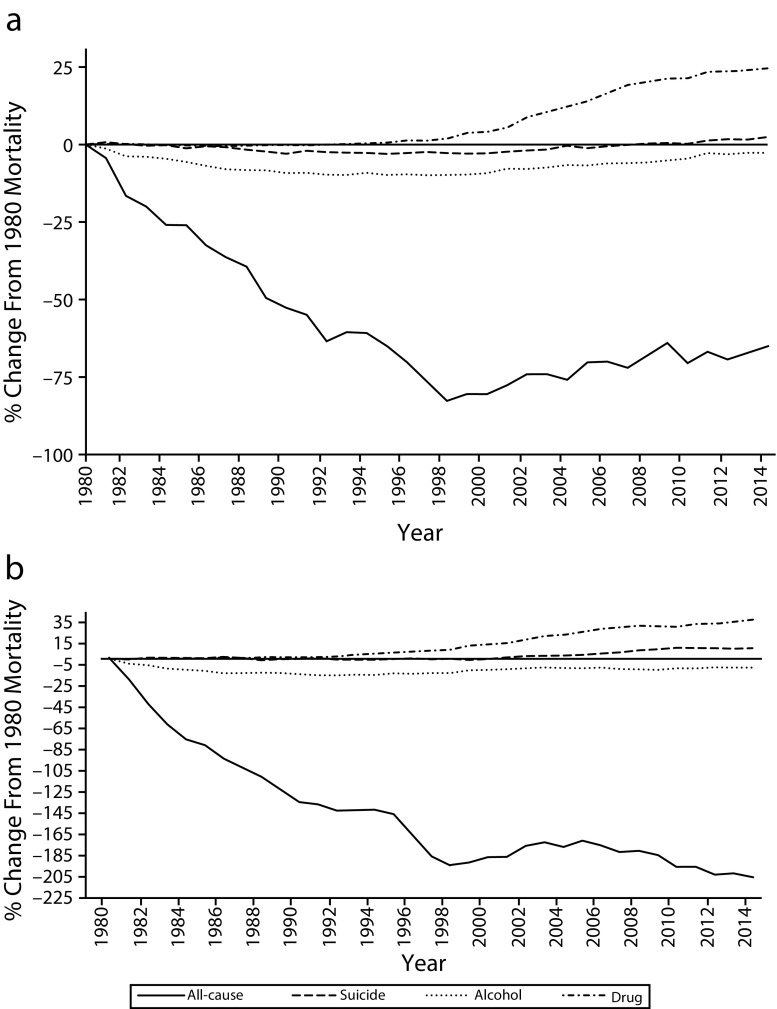
FIGURE 1—
All-Cause and Cause-Specific Percentage Changes in Mortality Rates Attributable to Drugs, Suicides, or Alcohol Among White 45- to 54-Year-Old (a) Women and (b) Men: United States, 1980–2013
Note. Drug and all-cause series: double line (=) indicates a negative correlation over time; solid line (–) within-man opioid deaths indicates a positive or null correlation over time.
Source. Data provided by Ryan Masters.

