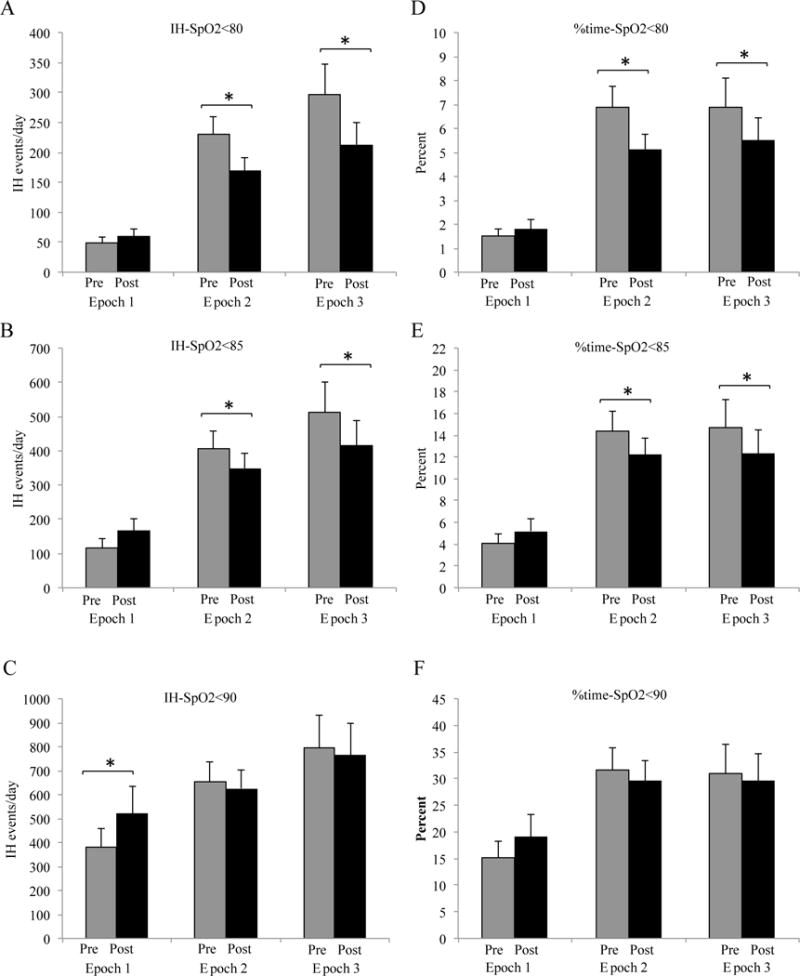
FIGURE 3.

IH events/day and % time below threshold pre and post transfusion. 3A-C: IH-SpO2<80 and IH-SpO2<85 decreased in epochs 2 and 3 (*p<0.04) while IH-SpO2<90 increased in epoch 1 (*p=0.04). 3D-F: % time-SpO2<80 and % time-SpO2<85 decreased in epochs 2 and 3 (*p<0.04). There was a decrease in % time-SpO2<90 in epochs 2 (p=0.2) and 3 (p=0.3) and increase in epoch 1 (p=0.07). Mean/standard deviation
