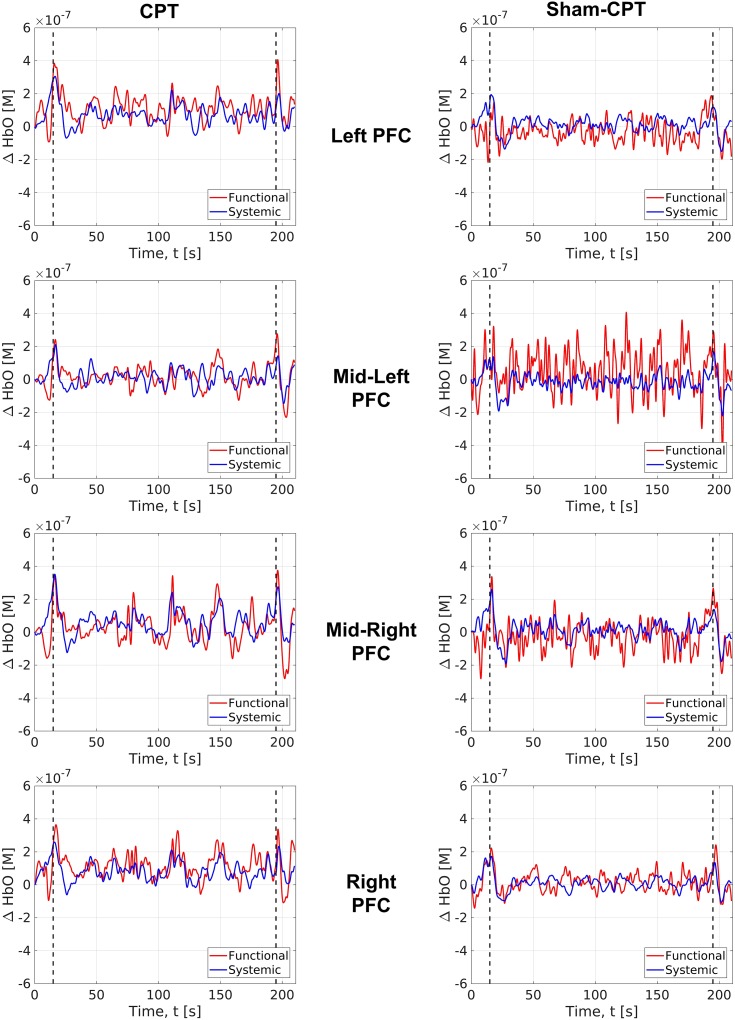
FIGURE 5.
OxyHb levels in the cortical areas (or functional changes) represented by red curves vs. OxyHb levels in the scalp/skull areas (or systemic changes) identified by blue curves. Values represented are averaged across participants in the Stress group (left column) and Control group (right column). The X-axis presents the duration of measurement (i.e., time). The Y-axis presents the measured levels of OxyHb. 0 in the Y-axis represents the start of measurement of OxyHb levels; all changes are assessed relative to this quantity of OxyHb. Top row represents these changes in the Left-PFC region (channels 1–5). Second row represents changes in the Mid-Left-PFC (channels 6–10). Third row represents changes in the Mid-Right-PFC (channels 11–15). Last row represents changes in the Right-PFC (channels 16–20).

