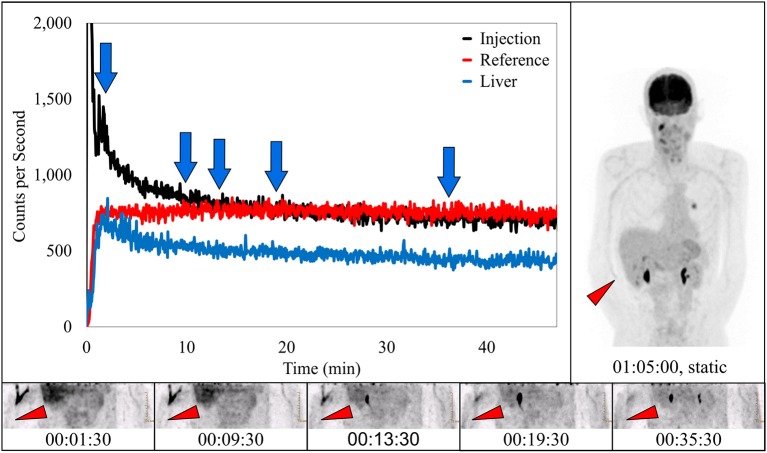
Figure 4.
Dynamically acquired images (bottom row) taken at various times (blue arrows) during uptake, static image (upper right), and black TAC (top curve) from injection arm sensor all reflect the complete resolution of a prolonged venous stasis. Red TAC reflects uptake captured by reference arm sensor on the non-injection arm during the uptake period. Blue TAC reflects liver uptake. Proximity to injection arm sensor and nature of the liver uptake played some role in injection arm sensor TAC interpretation. Patient was positioned on PET imaging table to ensure the injection site would be located near the caudal edge of the PET imaging bed. Red arrows on dynamic image acquisition frames and static image indicate approximate injection site (right antecubital fossa).

