Figure 2.
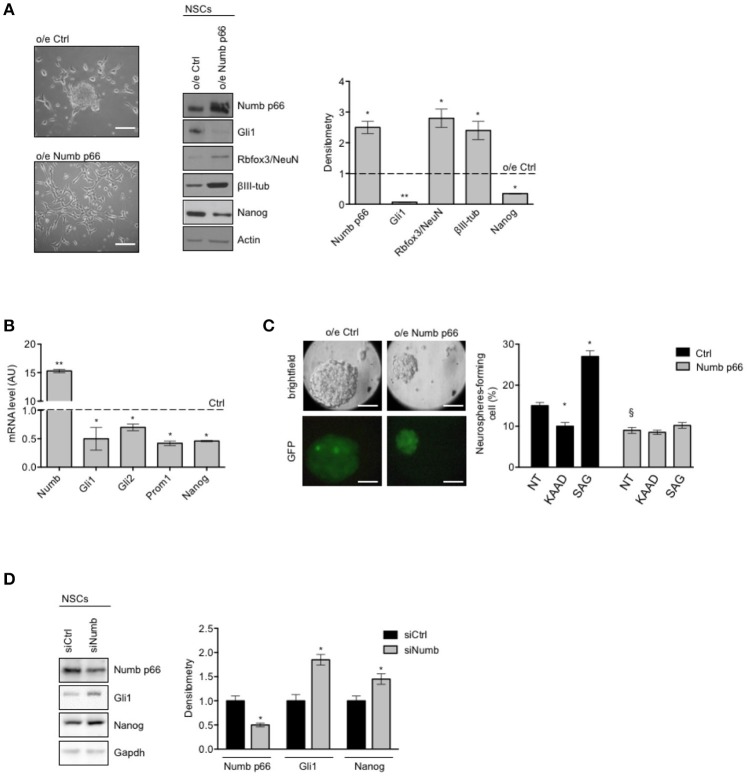
Numb antagonizes stemness and promotes differentiation of cerebellar NSCs. (A) (Left) Representative bright-field images of neurospheres after overexpression of p66 (or Ctrl). Scale bar: 100 μm. Representative western blot images (center) and densitometric analysis (right) of analysis of p66, stemness, and/or Hedgehog markers Nanog and Gli1 and differentiation markers Rbfox3/NeuN and βIII-tubulin (βIII-tub), in NSCs after overexpression of p66 vs. Ctrl. Actin was used as loading control. P-values *p < 0.05. (B) mRNA expression levels of Numb p66 and stemness and/or Hedgehog markers (Gli1, Gli2, Prom1, and Nanog), in NSCs after overexpression of p66. Dashed bars represent control cells (Ctrl). Data are means ± SD from three independent experiments. P-values *p < 0.05; **p < 0.01. (C) (Left) LvNumb-transduced NSCs were plated for clonogenic assay as described in Material and Methods. Upper panels show brightfield images of secondary neurospheres, lower panels show GFP of transduced cells. Scale bar: 100 μm. (Right) Neurosphere-formation capacity of LvNumb-transduced NSCs and treated with cyclopamine-KAAD (KAAD) to suppress endogenous Hedgehog signaling or with Smo-agonist (SAG). Data are means ± SD from three independent experiments. *P-values (vs. NT), *p < 0.05. §P-value (vs. LvCtrl), §p < 0.05. (D) Representative Western Blot (WB) (left) and densitometric analysis (right) of NSCs before and after in vitro differentiation for 48 h (PDGF); p66, Rbfox3/NeuN, Nanog were evaluated. Actin was used as loading control. P-values *p < 0.05. GAPDH was used as loading control. (A–D) Data are means ± SD from three independent experiments. Full-length images are presented in Supplementary Figures.

