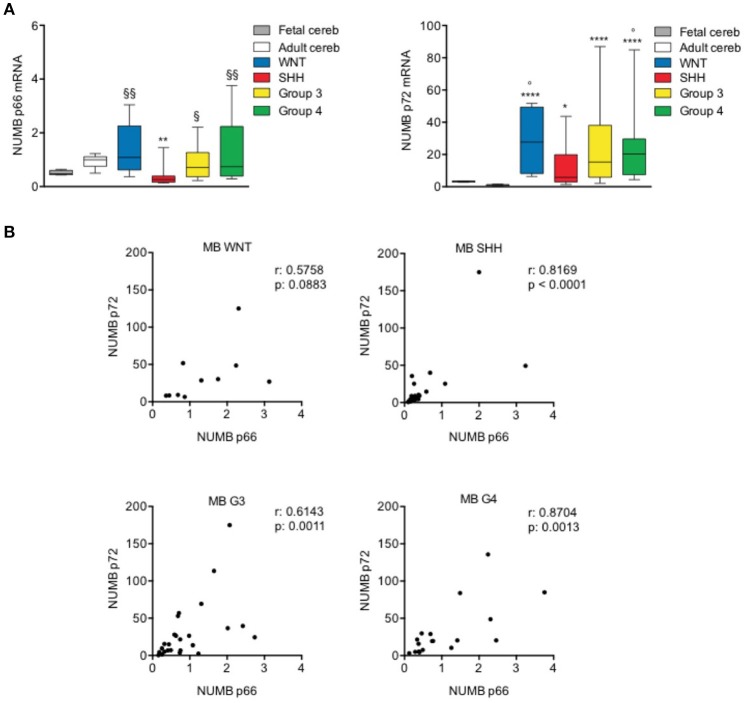
Figure 4.
NUMB isoforms expression in human MB samples. (A) qRT-PCR analysis showed NUMB isoforms [p66 (left) and p72 (right)] mRNA expression for molecular subgroups of primary MBs (WNT n: 10; SHH n: 25; G3 n: 25; G4 n: 19), adult normal cerebellum (Adult cereb) and fetal normal cerebellum (Fetal cereb). *P-value vs. Adult cereb, *p < 0.05; **p < 0.01; ****p < 0.0001. ° = P vs. Fetal cereb, °p < 0.05. §P-value vs. SHH MBs, §p < 0.05; §§p < 0.01. (B) Pearson's correlation test of p66 vs. p72, in human MB subgroups, to evaluate the link between the expression of NUMB isoforms (r = correlation coefficient; p < 0.05 significance).

