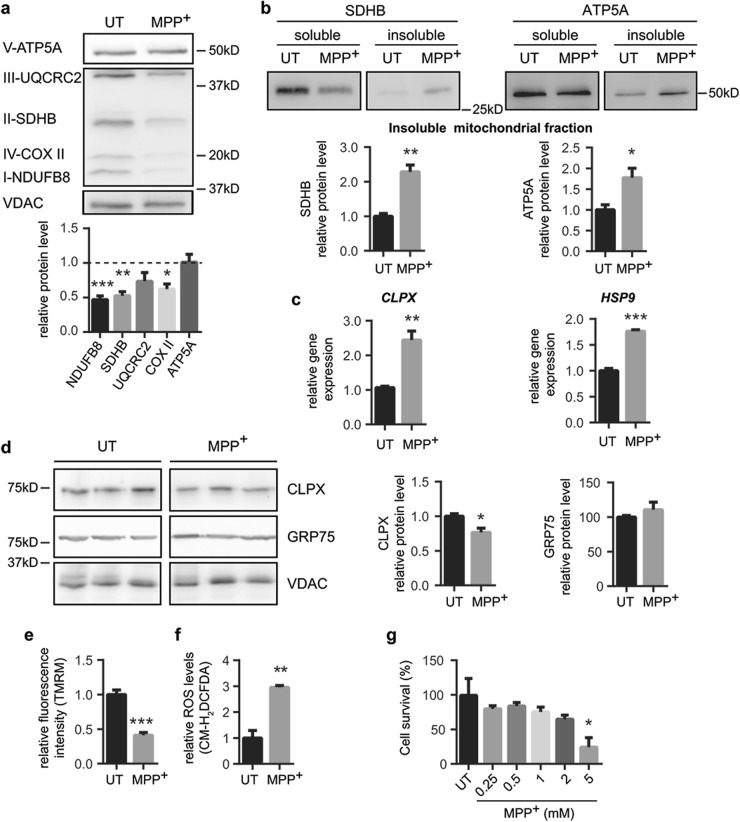
Fig. 3. Complex I inhibition leads to a mitochondrial dysfunction and cell death.
a–f BE(2)-M17 cells were treated with MPP+ (1 mM, 24 h) or untreated (UT). a Representative immunoblots of ATP5A (complex V), UQCRC2 (complex III), SDHB (complex II), COX II (complex IV), NDUFB8 (complex I) and VDAC protein levels normalized relative to VDAC (n = 3 independent experiments). Quantification is depicted as fold change to UT condition (*P < 0.05, **P < 0.01, ***P < 0.001 compared with UT condition after unpaired two-sided Student’s t-test). b Representative immunoblots of SDHB and ATP5A protein levels in soluble and insoluble mitochondria-isolated fractions (n = 3 independent experiments). Quantification is depicted as fold change to UT condition (*P < 0.05, **P < 0.01 after unpaired two-sided Student’s t-test). c CLPX and HSP9 gene expression levels normalized relative to RPLP0 (n = 3 independent experiments). Quantification is depicted as fold change to UT condition (**P < 0.01, ***P < 0.001 after unpaired two-sided Student’s t-test). d Representative immunoblots of CLPX, GRP75 and VDAC protein levels normalized relative to VDAC (n = 4 independent experiments). Quantification is depicted as fold change to UT condition (*P < 0.05 after unpaired two-sided Student’s t-test). e Mitochondrial membrane potential measured as TMRM fluorescence intensity. Quantification is depicted as the fold change in fluorescence intensity compared with UT condition (n = 3 independent experiments, ***P < 0.001 after unpaired two-sided Student’s t-test). f ROS production measured as CM-H2DCFDA fluorescence intensity. Quantification is depicted as the fold change in fluorescence intensity compared with UT condition (n = 3 independent experiments, **P < 0.01 after unpaired two-sided Student’s t-test). g In vitro sensitivity of BE(2)-M17 cells to increasing MPP+ concentrations for 24 h (n = 4 independent experiments). Cell survival was determined by MTT assay. Quantification is depicted as the % of cell survival relative to UT condition (*P < 0.05 after one-way ANOVA test followed by Tukey’s post hoc test). Error bars indicate s.e.m.

