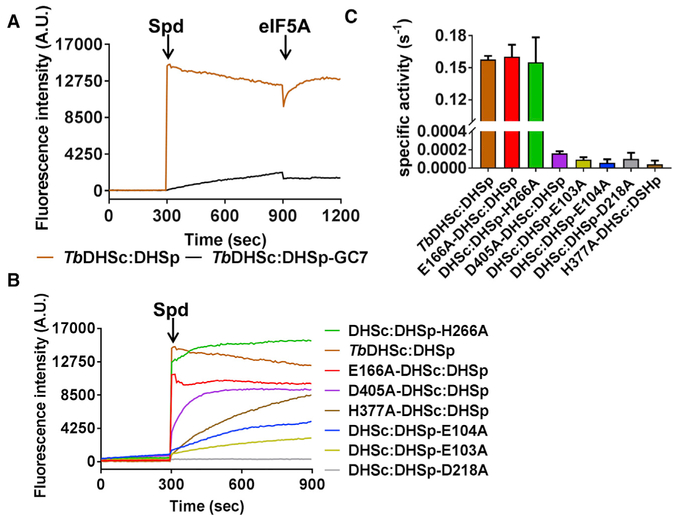
Figure 7. Single-Turnover and Steady-State Kinetic Analysis of TbDHSc:DHSp WT and Mutant Enzymes.
(A) Single-turnover NADH formation for WT TbDHSc:DHSp. NADH formation was monitored by fluorescence under single-turnover conditions for excitation at 350 nm and emission at 441 nm. Spermidine (Spd) (1 mM) was added to enzyme (1 μM) and NAD+ (1 mM) or eIF5A (15 μM) at the indicated time (orange line). Pre-incubation of TbDHSc:DHSp with 10 μM GC7 inhibits the reaction (black line). Experiments were done in duplicate and traces represent the average of the duplicate.
(B) Single-turnover NADH formation for TbDHSc:DHSp mutant enzymes. Mutant enzyme pairs are identified with symbols (Λ and #) as shown in Figure 4C.
(C) Steady-state kinetic analysis of WT and mutant DHS activity. For WT and active mutants, [DHS] = 5 nM, while inactive mutants were assayed at 1 μM. Substrate concentrations were 1 mM NAD+, 78 μM spermidine, and 15 μM eIF5A (KM = 0.7 μM), which represent saturating concentrations for the WT enzyme (Nguyen et al., 2013). Data were collected in triplicate, and error bars represent SEM. See also Tables S1 and S2.

