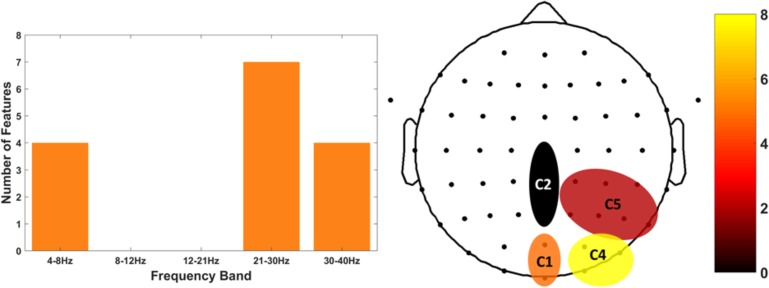
FIGURE 8.
Top 15 features distribution by frequency band (left) and clusters (right). The histogram on the left depicts the exploitability of theta and high-beta/gamma frequency features. The histogram of the right shows the scalp distribution of features within the right parietal-occipital region, showing a preference for the posterior clusters of the region.

