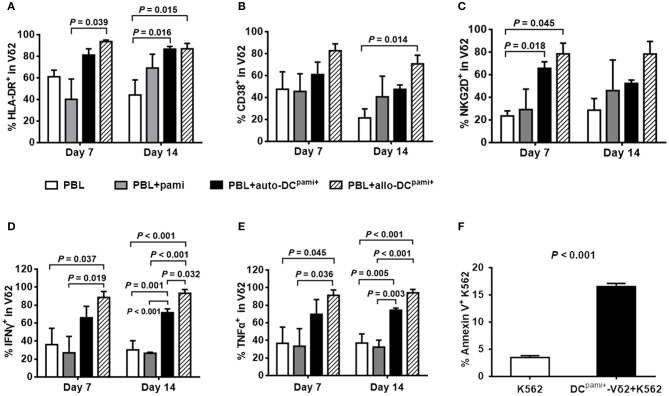
Figure 5.
The activation and cytokine production of Vδ2+ T cells from haploHSCT recipients after stimulation with pamidronate-pretreated DCs. The average proportions of HLA-DR+ (A), CD38+ (B), NKG2D+ (C), IFN-γ+ (D), and TNF-α+ (E) Vδ2 cells were compared among different treatment groups (n = 3). (F) Cytotoxicity assay of DCspami+-expanded Vδ2+ T cells with K562 cells. P-values are shown on the graphs.

