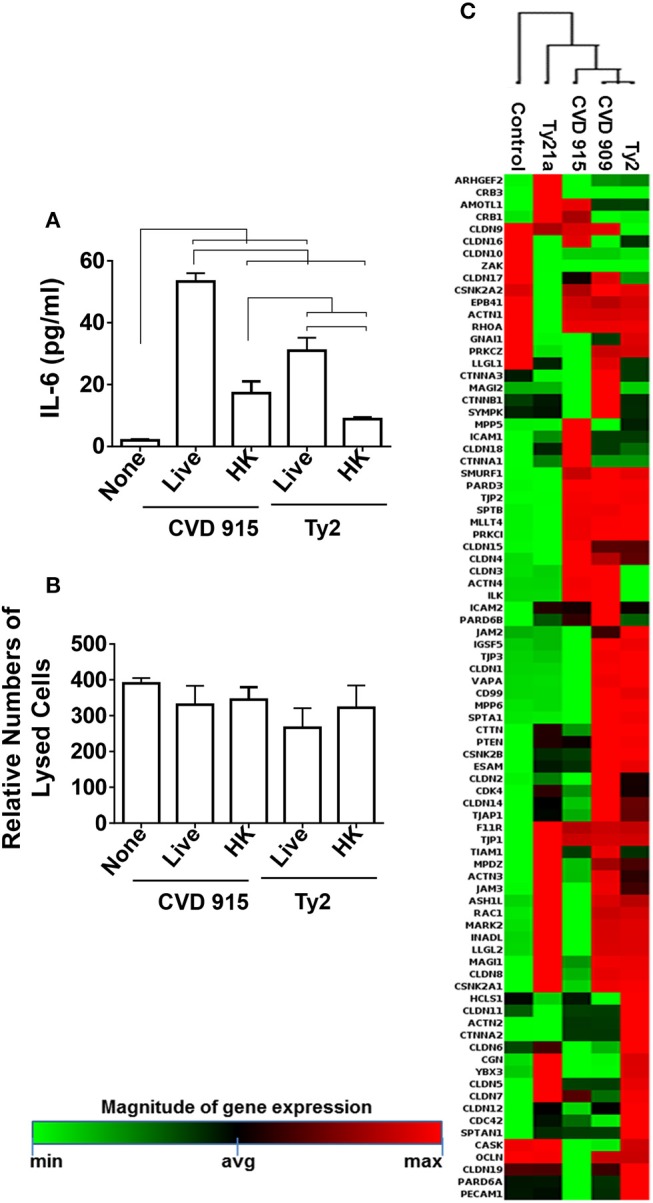
Figure 11.

Effect of S. Typhi exposure on the epithelial cell barrier. Cells from the 3-D model were untreated (none) or exposed to live or heat-killed (HK) S. Typhi strain CVD 915 or Ty2. (A) After 4 h, levels of IL-6 in the cultures supernatants were measured by Meso Scale Discovery (MSD) assay. Bars represent mean ± SE. Horizontal lines represent significant differences (p < 0.05) between the indicated culture conditions. (B) The cell viability was also measured in supernatants by commercial LDH assay. Bars represent means ± SE of 1 experiment with three replicates. (C) Cells from the 3-D model were untreated (none) or exposed to CVD 909, CVD 915, Ty2, or Ty21a S. Typhi strains. After 4 h, tissues were collected and used to measure the gene expression by qRT-PCR. Data shown represents an unsupervised clustergram displaying hierarchical clustering of the dataset as a heat map. Geometric mean values of two independent experiments with two replicates. Results are shown as x-fold regulation relative to the control group. Genes expression was detected by using the Tight Junctions RT2 Profiler PCR Array.
