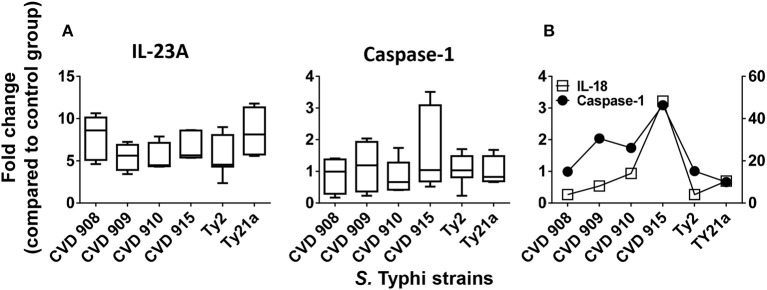
Figure 5.
IL-23A and inflammasome-caspase-1 pathway after stimulation with different S. Typhi strains. Cells from the 3-D model were untreated (none) or exposed to CVD 908, CVD 909, CVD 910, CVD 915, Ty2, or Ty21a S. Typhi strains. After 4 h, tissues were collected and used to measure gene expression by qRT-PCR. (A) IL-23A and caspase-1 gene expression by qRT-PCR. Bar graphs extend from the 25 to 75th percentiles, and the line in the middle represents the median of the pooled data. The whiskers delineate the smallest to the largest value. The data represent up to six individual experiments for each of S. Typhi strains with one or two replicates. (B) A representative experiment showing the concomitant expression of IL-18 and Caspase-1.

