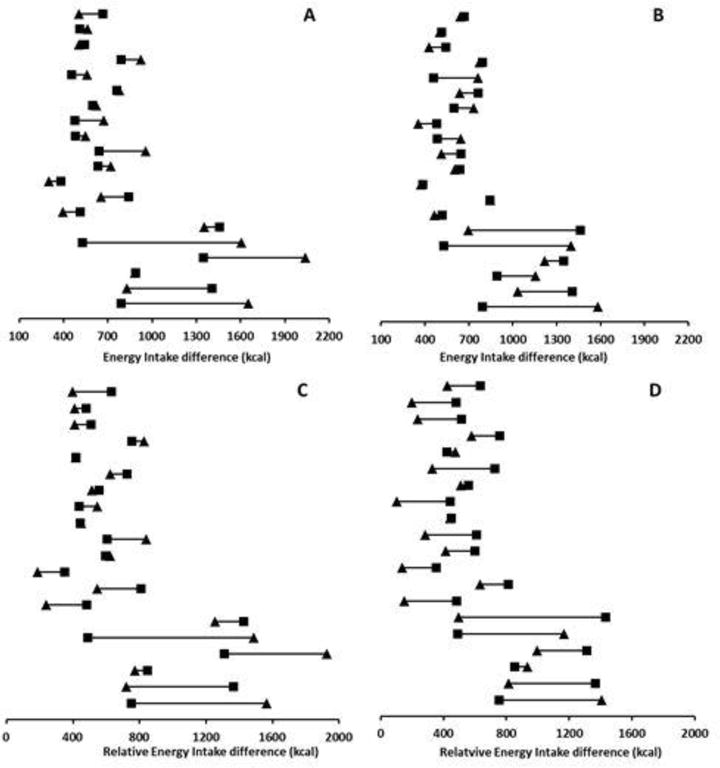
Figure 3.

Graphical representation of Individual variability of the absolute energy intake response after EX20 (A) and EX40 (B) compared with CON and of the relative energy intake in response to EX20 (C) and EX40 (D) compared with CON. CON: Control session, EX20: 20-minute cycling session; EX40: 40-minute cycling session; ■: EI (A and B) or REI (C and D) values during the CON condition; ▲ EI (A and B) or REI (C and D) values during the EX20 (A and C) and EX40 (B and D) sessions.
