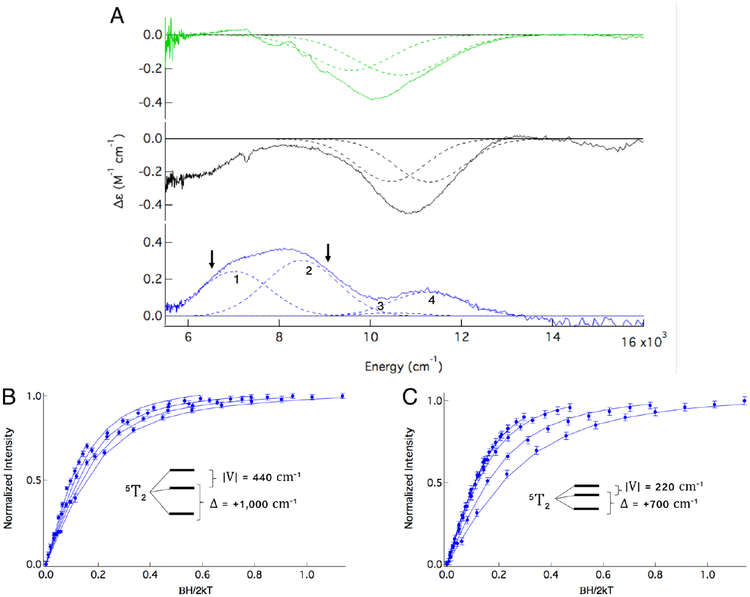
Figure 2:
(A) Room temperature CD (green), 5K CD (black) and +5T, 5K MCD (blue) spectra of (FeII/GSS−)-ETHE1 with Gaussian fits. Intensity at 6,000 cm−1 in black spectrum is due to a baseline issue from glass strain. Arrows in blue spectrum indicate where saturation magnetization data were collected (B) at 6,450 cm−1 and (C) at 8,900 cm−1.

