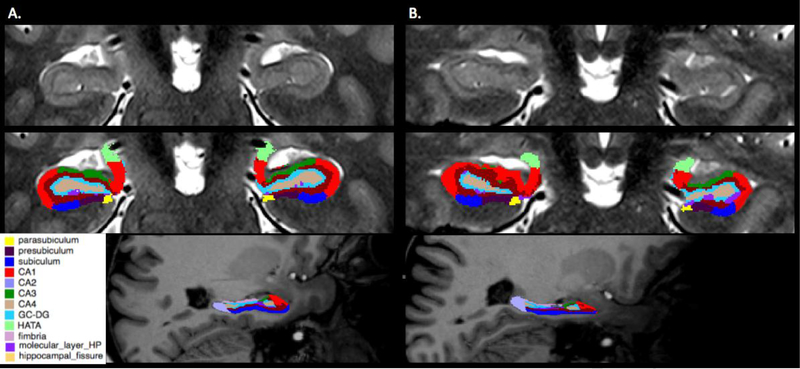
Figure 1.
Examples of automated hippocampal subfield segmentation derived from Freesurfer version 6.0 in a healthy control (column A) and an epilepsy patient (column B). Row 1 contains unlabeled coronal mid- hippocampal sections on a T2-weighted image. Row 2 shows the same sections with colored subfield overlays. Row 3 exhibits sagittal color overlay representations on a T1-weighted image with anterior to the reader’s right. CA4 corresponds to the hilar portion of the CA3 field.

