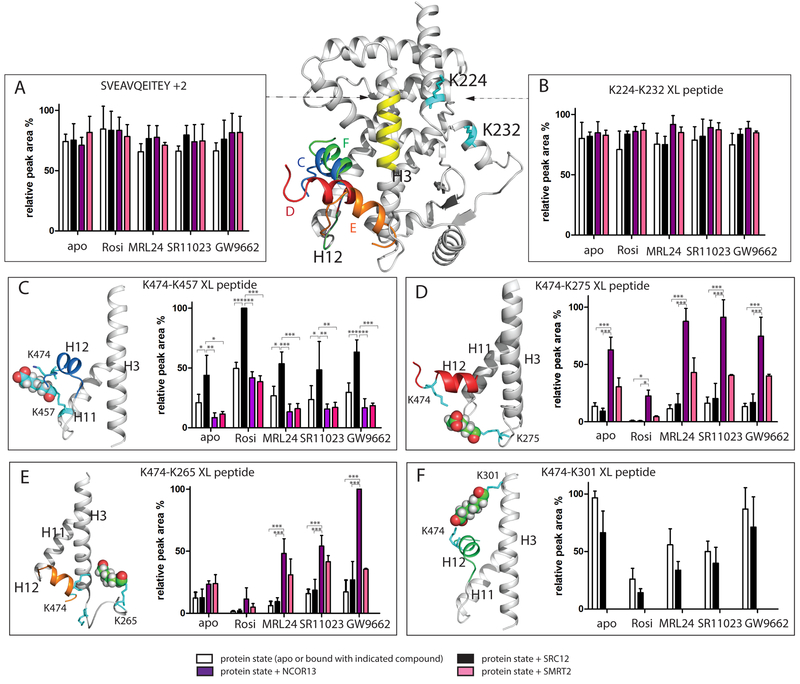
Figure 2. Influence of ligand and NR box peptide on H12 mobility revealed by BS3 crosslinking MS.
Different H12 orientations in PPARγ LBD are superimposed in the PPARγ LBD, as shown by an ensemble of structural models of different orientations of H12 (K474) conjugated to K457 (blue H12, Figure 2C), K275 (red H12, Figure 2D), K265 (orange H12, Figure 2E) and K301 (green H12, Figure 2F). Yellow, H3 residue region SVEAVQEITEY; Cyan: BS3 conjugated lysine residues shown in stick. (A) relative peak area of non-XL peptide SVEAVQEITEY. (B) relative peak area of K224-K232 XL peptide. Results are expressed as mean +/− SEM. (C-F) relative peak area of K474-K457, K474-K275, K474-K265 and K474-K301 XL peptide, respectively. All results are expressed as mean +/− SEM. Statistical analysis was performed by two-way ANOVA between indicated pairwise experiment (*** = p<0.001; ** = p<0.01; * = p<0.05). DynaXL program is used to generate input structure calculation scripts that is further used by the xplor-nih program for structure modeling of XL-MS data. The data is consistent with models for both PPARγ alone and the PPARγRXRα heterodimer complex. See also Figure S3 and Figure S4.

