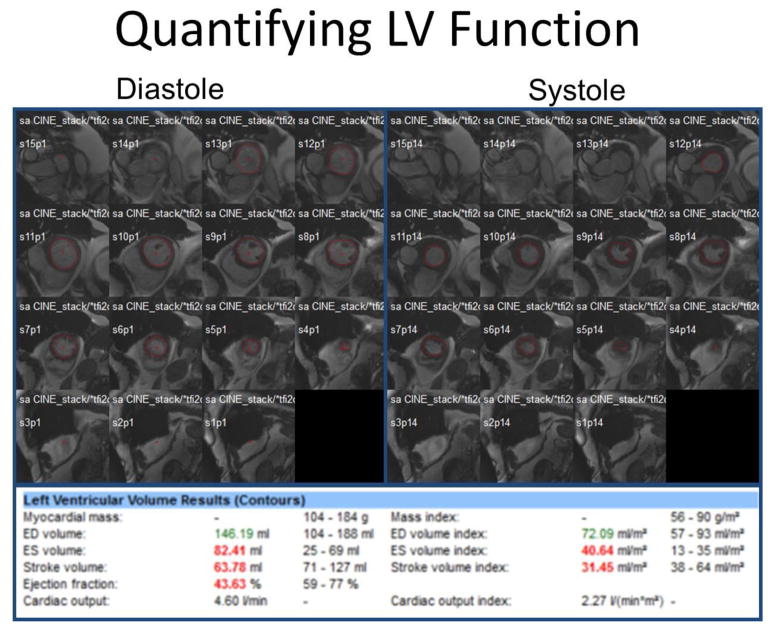
Fig. 3.
For LV chamber quantification, endocardial (red) contours are delineated at end-diastole (left) and end-systole (right) in a stack of short axis slices that cover the entire left ventricle. Computer-aided analysis packages are used to calculate LV parameters as shown. This patient has a decrease in EF and increase in end-systolic volume which can be seen in CTRCD.

