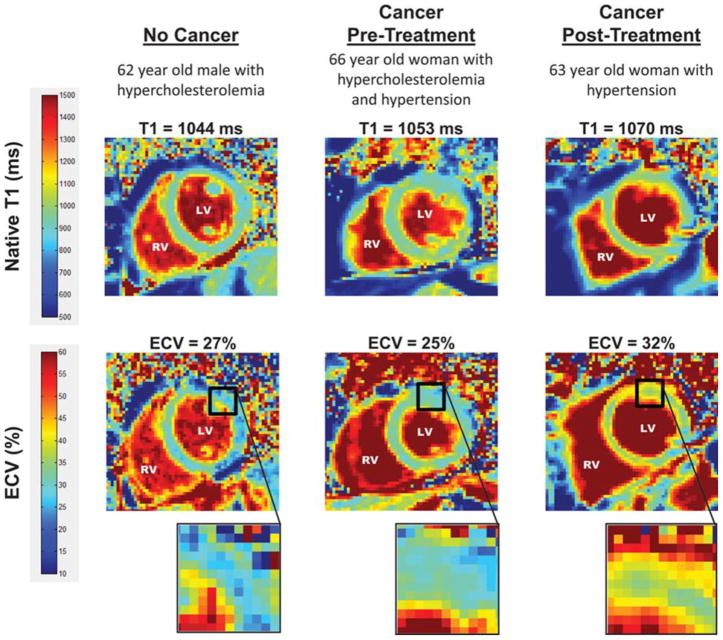
Fig. 6.
T1 and ECV map images. Representative left ventricular (LV) short-axis native T1 (top row) and extracellular volume (ECV, bottom row) maps are shown in similarly-aged participants. The LV and right ventricular (RV) blood pool cavities are noted. On each image, the color of pixels in the images (color scales on left) identifies the native T1 (milliseconds) and ECV (%). Insets on the ECV maps demonstrate the change in color intensity within the anterolateral wall of each ventricle. As shown, ECV is elevated in the cancer survivor previously treated with anthracycline-based chemotherapy. Borrowed with permission from Jordan et al. Circulation Imaging. 2016. 41

