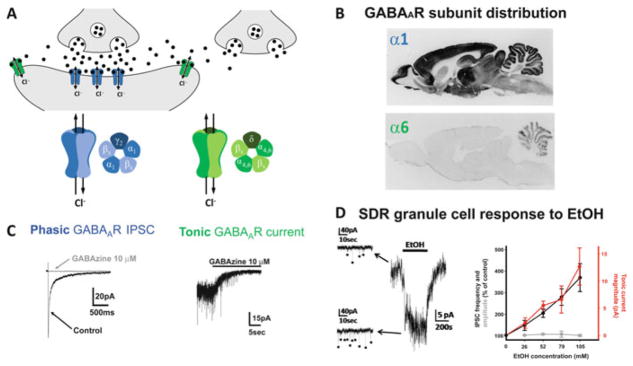
Fig. 1.
Phasic and tonic GABAAR currents and modulation by EtOH, as exemplified by cerebellar granule cells. (a) Schematic diagram showing GABAARs in the synaptic cleft (blue) and outside of the synaptic cleft (green). Synaptic GABAARs are typically comprised of two α subunits (with α1 dominating at most synapses), two β subunits, and a γ subunit. Extrasynaptic GABAARs replace the γ subunit with a δ subunit which is crucial for anchoring the receptor complex extrasynaptically, and at most synapses is paired with either the α4 (hippocampus and thalamus) or α6 (cerebellum) subunit [as in (b), bottom panel], although other permutations also exist. (b) Immunocytochemistry for the α1 (top) and α6 (bottom) subunit of the GABAAR receptor. Note, the α6 subunit is exclusively expressed in granule cells. (c) Phasic IPSCs (left) are mediated by synaptic GABAARs (as evidenced by their sensitivity to the GABAAR antagonist, GABAzine) that are rapidly activated by the high concentrations of vesicular GABA released into the synaptic cleft, and their decay time is dictated by receptor desensitization and inactivation as GABA is cleared from the synaptic cleft by diffusion and uptake by GABA transporters. Tonic GABAAR-mediated currents (right; steady state current blocked by GABAzine; downward deflections superimposed on the tonic current are phasic IPSCs that are also blocked by GABAzine) are mediated by extrasynaptic GABAARs that have a higher affinity for GABA and do not readily desensitize, and so generate a steady state current that varies in accordance with the concentration of ambient extracellular GABA. Note, because GABA released into the synaptic cleft diffuses out of the cleft where it can activate extrasynaptic GABAARs, the magnitude of the tonic GABAAR current increases or decreases in parallel with changes in vesicle release rate, either from the presynaptic neuron or from neighboring synapses not directly connected to the recorded cell. (d) Example voltage-clamp recording (left) showing that EtOH (52 mM) increases sIPSC frequency and tonic GABAAR current magnitude in a granule cell in a slice of cerebellum from a low EtOH consuming Sprague Dawley rat (SDR). EtOH dose–response plot (right) shows the mean enhancement of sIPSC frequency (black) and tonic GABAAR current magnitude (red), without affecting sIPSC amplitude (gray). Images are adapted with permission from Mohr et al. (2013) and Pirker et al. (2000)

